



Week Ending February 13, 2026
WEEKLY TOUCHPOINT
Taxes: It’s a Matter of Perspective
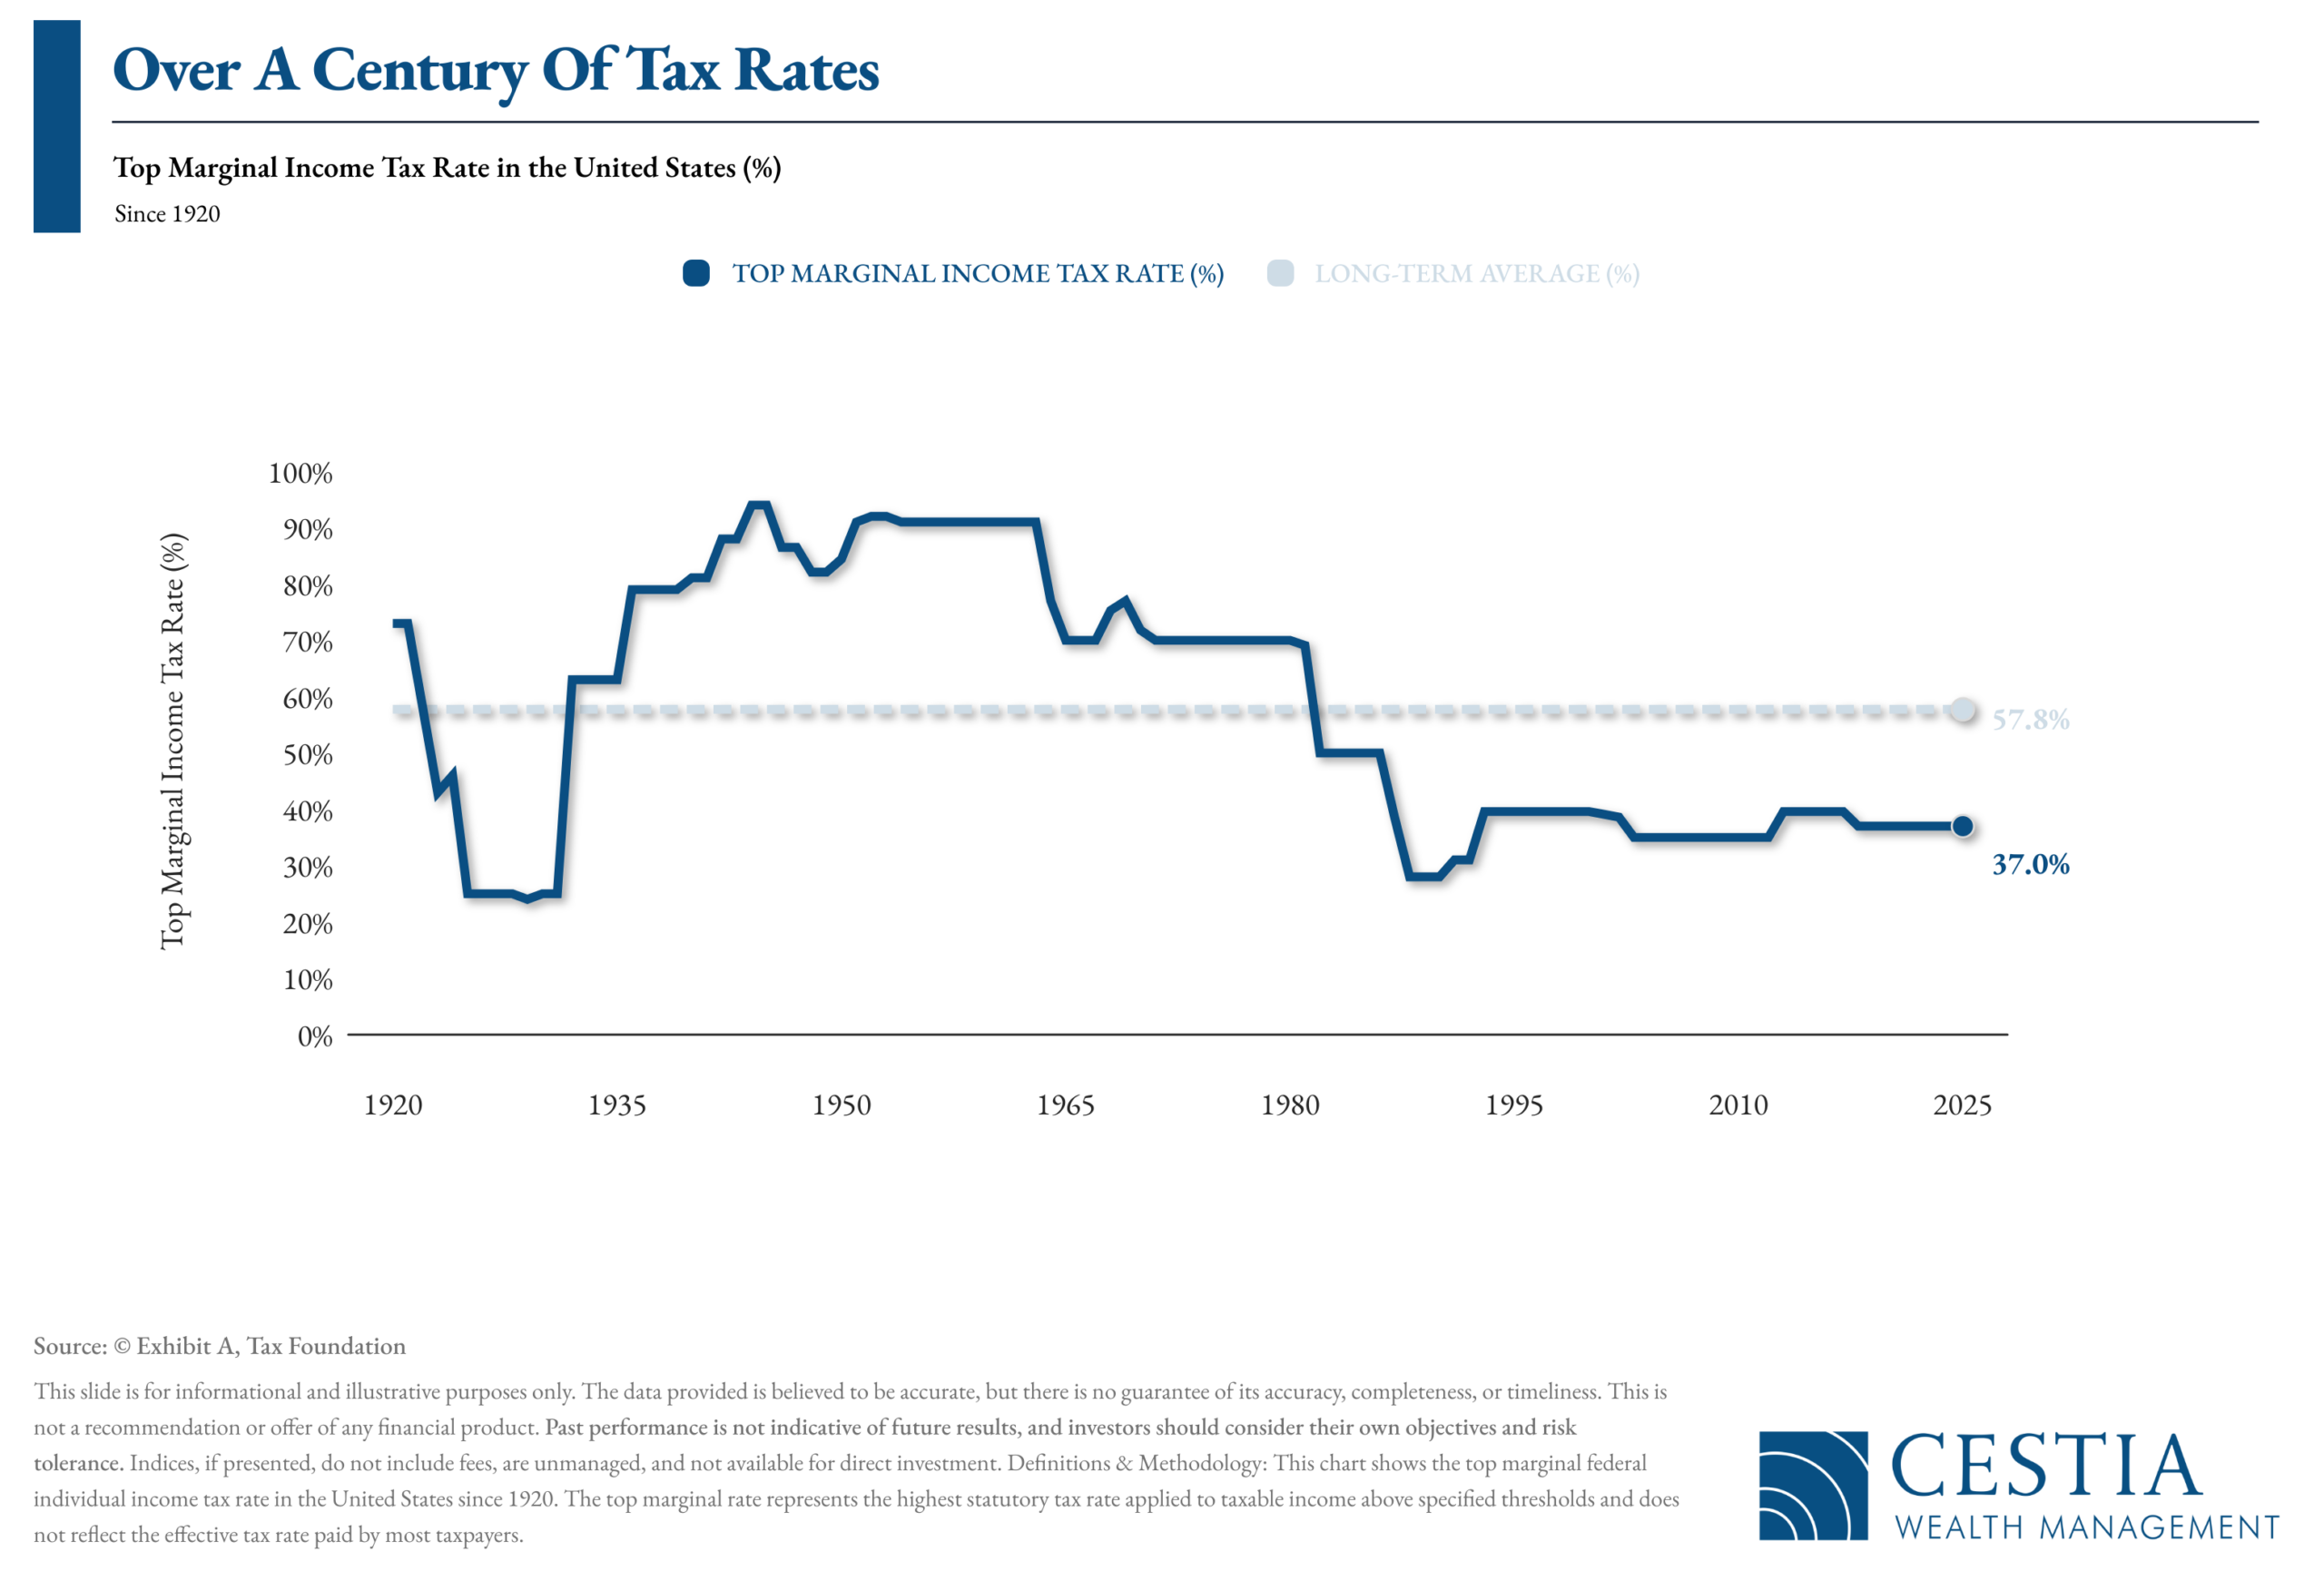
When we zoom out and look at the top marginal federal income tax rate since 1920, something interesting happens — today’s 37% rate starts to look… relatively modest. Historically, the long-term average top rate has been more than 20 percentage points higher than where we sit now. In fact, during the 1940s and 1950s, top rates climbed above 90% before gradually settling lower over the decades.
For investors and business owners, this isn’t about predicting higher taxes tomorrow — it’s about context. Taxes may feelhigh in the moment, but history reminds us that we’re operating in a comparatively lower-rate environment. That perspective matters when we think about Roth conversions, capital gains realization, estate planning strategies, and long-term wealth transfer.

AI and the Economics of the Human Touch
Utilities Soar On Surging Power Demand From Data Centers
Analyst Highlights Focus for London International Energy Week

What Documents Do I Need To Collect For Filing My Tax Return?
Filing your taxes is never fun. Whether working with a tax professional or doing it on their own, clients may feel stress. With our guidance, clients will be better equipped to navigate the process of gathering their documents for filing their taxes. This checklist covers the key issues to consider when preparing to file one’s taxes, such as:
- Documents and information to gather for your sources of income.
- Documents and information to gather for potential tax deductions.
- Documents and information to gather for potential tax credits.
- Other important nuances to consider when preparing to file your taxes.
SOURCE: fpPathfinder

(as of Monday’s Market Opening)
| Total Return (1D) | Total Return (1W) | Total Return (MTD) | Total Return (QTD) | Total Return (YTD) | |
| S&P 500 | 0.05% | -1.85% | -1.48% | -0.14% | -0.14% |
| Dow Jones Industrial Average | 0.10% | -1.27% | 1.24% | 2.99% | 2.99% |
| NASDAQ | -0.22% | -2.98% | -3.90% | -2.99% | -2.99% |
| NASDAQ 100 | 0.18% | -2.12% | -3.21% | -2.05% | -2.05% |
| Russell 1000 | 0.12% | -1.27% | -1.25% | 0.08% | 0.08% |
| Russell 2000 | 1.32% | -0.78% | 1.27% | 6.82% | 6.82% |
| Russell 3000 | 0.17% | -1.24% | -1.11% | 0.37% | 0.37% |
| ACWI | 0.20% | -0.23% | 0.30% | 3.15% | 3.15% |
Global Client Survey
We’re inviting you to take part in a quick, anonymous client survey. Your feedback helps us fine-tune our process, elevate your experience, and ensure we’re delivering what matters most to you. This isn’t just about checking a box—it’s about shaping the future of how we serve you. Your voice helps guide our next steps. We’re listening. We’re learning. And we’re grateful for your trust.
Take Our Survey Now
Disclosures
- Wealth Mechanics™ is a registered trademark of Cestia Wealth Management. Unauthorized use of the trademark, including but not limited to commercial use, reproduction, or imitation without explicit written permission from Cestia Wealth Management, is strictly prohibited.
- Market commentary provided by NewEdge Advisors
- Charts concerning market data are provided by Exhibit A.
- Guides and other downloadable firm material respective to financial planning processes and data are provided and powered by fpPathfinder.
- Advisory services offered through NewEdge Advisors, LLC, a registered investment adviser. Securities offered through NewEdge Securities, LLC. Member FINRA/SIPC. NewEdge Advisors, LLC and NewEdge Securities, LLC are wholly owned subsidiaries of NewEdge Capital Group, LLC.
- Cestia Wealth Management is not a legal tax professional. We offer tax gap analysis for clients who desire to have a comprehensive financial plan, which requires in-depth tax strategy and planning as a distinct part of the overall customized solution. Please consult your tax professional on all matters addressed in this report.
- Information about annuities are not to be considered a recommendation. The information provided should not considered a recommendation to purchase or sell any particular security.
- Investing involves risk, including the potential loss of principal. No investment strategy can guarantee a profit or protect against loss in periods of declining values. Past performance is no guarantee of future results. Please note that individual situations can vary. Therefore, the information presented here should only be relied upon when coordinated with individual professional advice.
