



Week Ending February 20, 2026
WEEKLY TOUCHPOINT
Meme Stock Lessons Learned
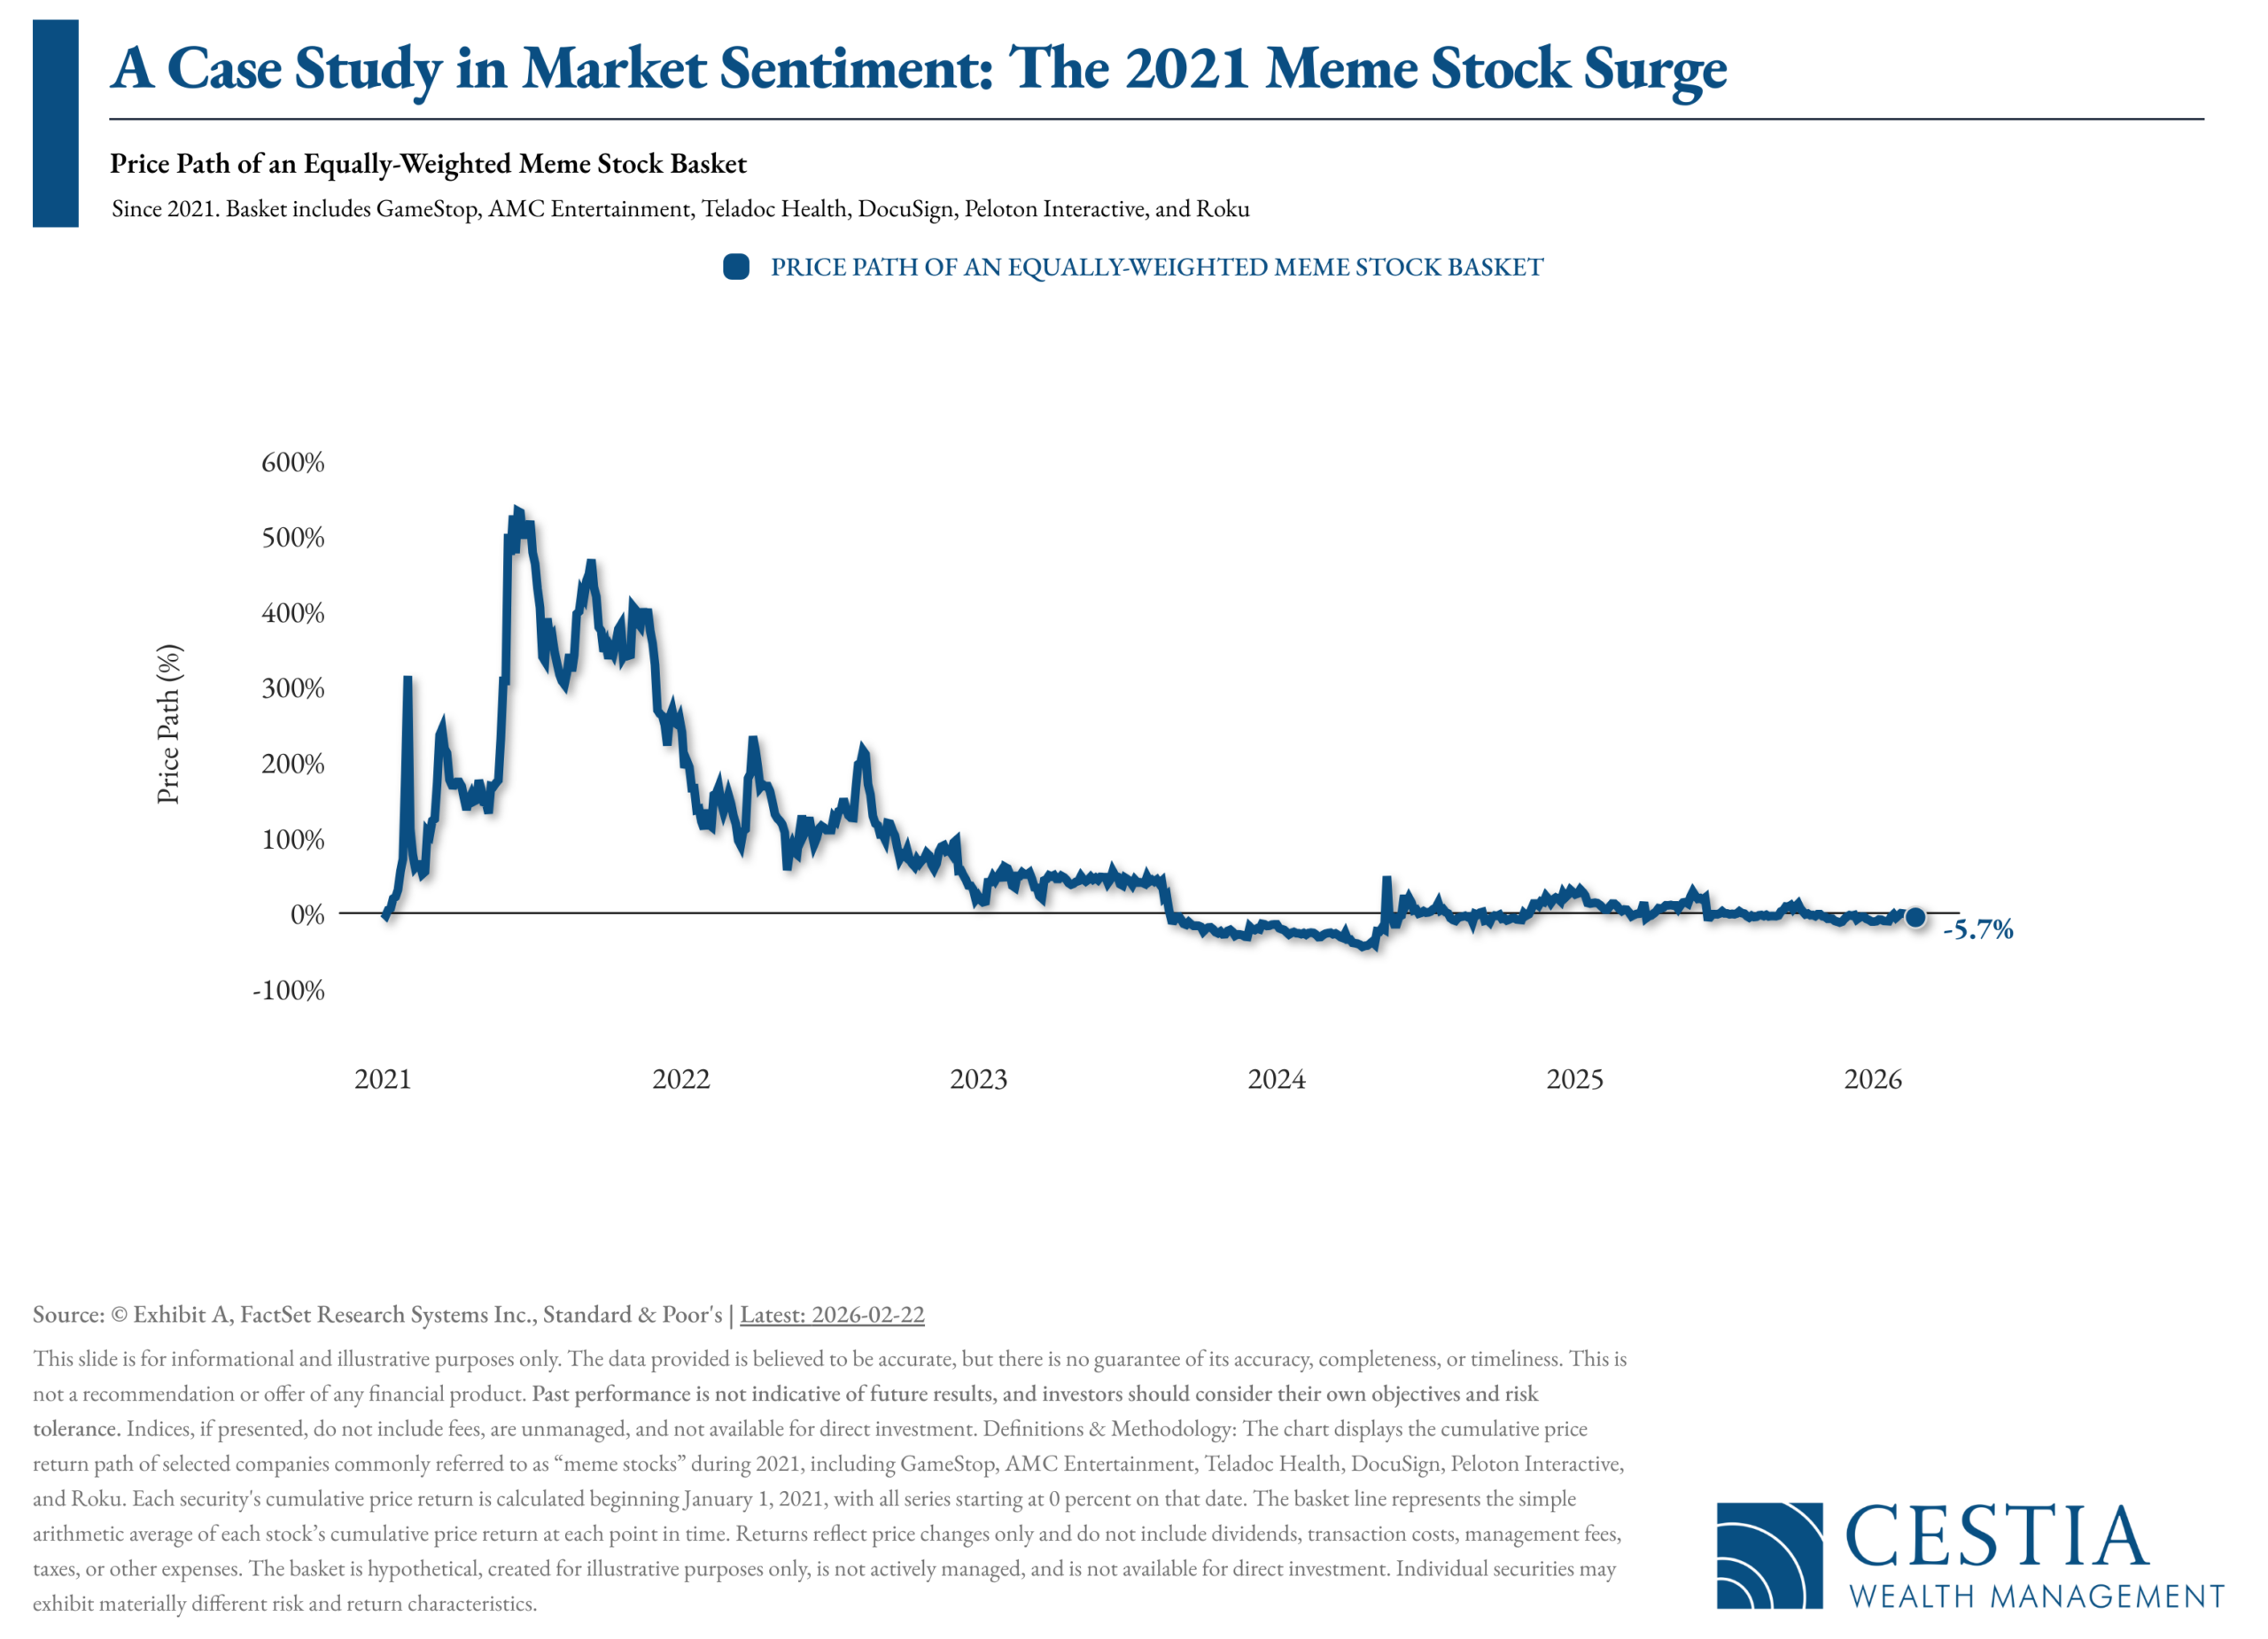
There’s an old lesson resurfacing in the data this week. A basket of so-called “meme stocks” — including names like GameStop, AMC, Teladoc, DocuSign, Peloton, and Roku — captured enormous attention during the 2021 surge in retail trading. This chart tracks their cumulative performance since that period, and the result may surprise some: on an equally weighted basis, the group is down roughly 5.7% since 2021.
It’s a helpful reminder that while market sentiment can drive dramatic short-term price spikes, long-term outcomes tend to be shaped by fundamentals, cash flows, and durability of business models. Excitement can be powerful — but discipline has historically been more reliable.

Tracking the Short-Run Price Impact of U.S. Tariffs
Trump Deploys New Tariff Tactics After Supreme Court Rejects Emergency Levies

Common Home Equity Options
For many clients, their home is one of their largest financial assets. But they may not realize how it can be used to support their financial goals. Whether a client is navigating a large expense, considering home improvements, or looking to consolidate debt, it’s important to evaluate which home equity strategy, if any, may make sense for their situation.
This summary guide helps facilitate your conversations with clients who are exploring ways to tap into their home’s equity, and covers:
- Home Equity Line of Credit (HELOC)
- Home Equity Loan
- Cash-Out Refinance
- Key differences in payment terms, interest rates, and borrowing limits
- Considerations like underwriting requirements, closing costs, and repayment structures
SOURCE: fpPathfinder

Equities
- U.S. stocks pushed higher in the holiday-shortened week, with the S&P 500 up 1.24%, as investors responded positively to strong earnings and the Supreme Court’s decision striking down recent trade tariffs.
- Large-cap growth stocks led the charge, reversing recent underperformance and working to close the year-to-date gap versus value stocks.
- Cyclical sectors continued building momentum — industrials, financials, and energy contributed meaningfully to gains.
- Oil climbed to a six-month high amid escalating U.S.–Iran tensions, adding fuel to the energy sector’s strength.
- Defensive sectors like health care and consumer staples pulled back after several weeks of outperformance. International markets were positive but lagged U.S. stocks.
Bonds
- Bond prices slipped as Treasury yields moved higher following FOMC minutes showing policymakers remain divided between supporting employment and containing inflation.
- The 2-Year Treasury yield rose to 3.48%, while the 10-Year increased to 4.08%.
- Long-duration high-yield bonds were the best-performing area of fixed income.
- Long-duration government bonds lagged as rising yields pressured prices.
- Corporate bond yields were steady, with investment-grade at 4.74% and high-yield at 7.06%.
Macroeconomic Data
- Housing sentiment weakened, with the NAHB index falling to 36 as affordability challenges persist.
- Industrial production surprised to the upside, rising 0.7%, driven by the strongest manufacturing gain since early 2025.
- The U.S. trade deficit widened to $70.3B, one of the largest on record, as imports climbed to new highs.
- Q4 GDP slowed to 1.4%, reflecting softer government and consumer spending.
- Inflation ticked higher, with Core PCE reaching 3.0% year-over-year — its highest level in nearly a year — while services activity cooled to a 10-month low.

(as of Monday’s Market Opening)
| Total Return (1D) | Total Return (1W) | Total Return (MTD) | Total Return (QTD) | Total Return (YTD) | |
| S&P 500 | 0.69% | 1.07% | -0.43% | 0.93% | 0.93% |
| Dow Jones Industrial Average | 0.47% | 0.25% | 1.50% | 3.25% | 3.25% |
| NASDAQ | 0.90% | 1.51% | -2.45% | -1.53% | -1.53% |
| NASDAQ 100 | 0.87% | 1.13% | -2.11% | -0.94% | -0.94% |
| Russell 1000 | 0.66% | 1.14% | -0.12% | 1.22% | 1.22% |
| Russell 2000 | 0.00% | 0.63% | 1.91% | 7.50% | 7.50% |
| Russell 3000 | 0.61% | 1.12% | -0.01% | 1.50% | 1.50% |
| ACWI | 0.88% | 1.16% | 1.46% | 4.34% | 4.34% |
Global Client Survey
We’re inviting you to take part in a quick, anonymous client survey. Your feedback helps us fine-tune our process, elevate your experience, and ensure we’re delivering what matters most to you. This isn’t just about checking a box—it’s about shaping the future of how we serve you. Your voice helps guide our next steps. We’re listening. We’re learning. And we’re grateful for your trust.
Take Our Survey Now (click here)
Disclosures
- Wealth Mechanics™ is a registered trademark of Cestia Wealth Management. Unauthorized use of the trademark, including but not limited to commercial use, reproduction, or imitation without explicit written permission from Cestia Wealth Management, is strictly prohibited.
- Market commentary provided by NewEdge Advisors
- Charts concerning market data are provided by Exhibit A.
- Guides and other downloadable firm material respective to financial planning processes and data are provided and powered by fpPathfinder.
- Advisory services offered through NewEdge Advisors, LLC, a registered investment adviser. Securities offered through NewEdge Securities, LLC. Member FINRA/SIPC. NewEdge Advisors, LLC and NewEdge Securities, LLC are wholly owned subsidiaries of NewEdge Capital Group, LLC.
- Cestia Wealth Management is not a legal tax professional. We offer tax gap analysis for clients who desire to have a comprehensive financial plan, which requires in-depth tax strategy and planning as a distinct part of the overall customized solution. Please consult your tax professional on all matters addressed in this report.
- Information about annuities are not to be considered a recommendation. The information provided should not considered a recommendation to purchase or sell any particular security.
- Investing involves risk, including the potential loss of principal. No investment strategy can guarantee a profit or protect against loss in periods of declining values. Past performance is no guarantee of future results. Please note that individual situations can vary. Therefore, the information presented here should only be relied upon when coordinated with individual professional advice.
