



Week Ending February 27, 2026
WEEKLY TOUCHPOINT
Are we in a Bubble?
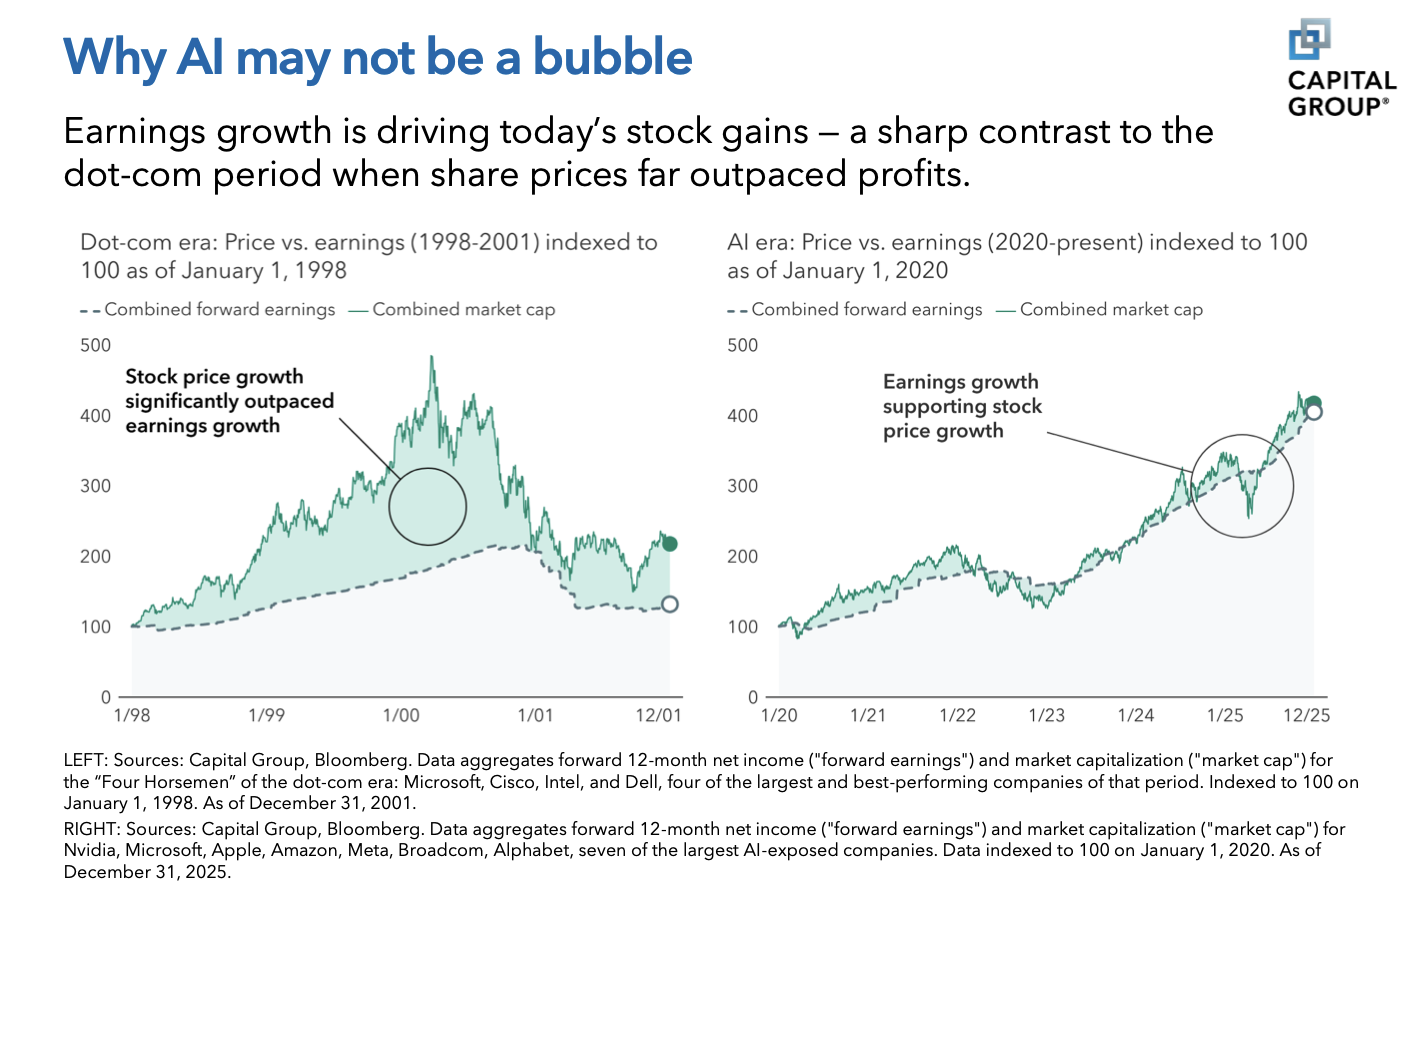
Capital Group. recently shared an interesting point:
Soaring AI stocks have prompted comparisons with the late-1990s tech stock boom — and painful bust. If a bubble is forming, the question is where we are on that timeline. Is the year 2000 an appropriate analogy, which would imply a bubble is about to pop, or is it 1998, indicating that AI stocks have room to run? For now, fundamentals for AI stocks look healthy. Today’s AI leaders are generally supported by solid earnings growth. What’s more, companies making aggressive AI-related investments — Alphabet, Amazon, Broadcom, Meta, Microsoft and NVIDIA, among others — can support their massive capital spending far better than the upstarts of the late 1990s. The conclusion? It’s too early to let the risk of a bubble overcome the opportunities presented by this formidable technology.

Mortgage rates just dropped below 6%
AI Anxiety Is Tanking Stocks. Here’s the HALO
US Housing Market Doesn’t Have Much ‘Tailwind’
OpenAI Wins Pentagon Work as Altman Tries to Square Circular Deals
All the highlights from Berkshire CEO Abel’s first shareholder letter

Taxation Guide To Withdrawals And Income Sources
Managing withdrawals and understanding their tax implications is a crucial part of developing a successful financial plan. That’s why we’ve created the “Taxation Guide to Withdrawals & Income Sources” summary guide—a comprehensive resource for advisors and clients alike.
This guide provides a high-level overview of the various accounts or assets from which clients might pull funds for income or funding goals, as well as the tax consequences for each source.
By having a clear understanding of how different withdrawal sources impact tax liability, advisors can help clients make informed decisions that optimize their tax situation.
With this guide, advisors can ensure their clients are pulling from the right sources at the right time, minimizing tax impacts and maximizing financial success.
This guide covers:
- Which withdrawal/income sources are subject to certain types of taxation (e.g., federal, state, 3.8% NIIT, etc.).
- Which withdrawal/income sources may have additional penalties.
- Whether certain withdrawal/income sources increase one’s AGI.
- Important planning nuances to be aware of regarding specific withdrawal/income sources.
Taxation-Guide-To-Withdrawals-And-Income-Sources-2
SOURCE: fpPathfinder

Equities
- U.S. stocks moved lower as investors shifted into a risk-off posture amid AI disruption fears, geopolitics, and trade uncertainty.
- Despite a strong earnings report from NVIDIA, technology stocks led markets lower into week’s end.
- Value stocks continued to outperform growth, widening the year-to-date performance gap.
- Defensive and rate-sensitive sectors benefited as Treasury yields declined and pressure persisted in tech and financials.
- International equities outperformed U.S. markets, helped by stronger local returns and a softer dollar.
Bonds
- Long-term government bonds outperformed as interest rates declined across the curve.
- The 10-year Treasury yield fell to 3.97%, dipping below 4% for the first time this year.
- The 2-year yield dropped to 3.38%, leaving the yield curve slope relatively unchanged.
- High-yield bonds weakened slightly as credit spreads widened; yields rose to 7.16%.
- The average 30-year mortgage rate fell below 6.0% for the first time in 3.5 years.
Macroeconomic Data
- Inflation concerns resurfaced as Producer Price Index (PPI) rose 0.5%, above expectations, driven by higher service prices.
- National home prices increased 1.3% in 2025, trailing inflation, though Chicago and New York posted gains above 5%.
- New orders for manufactured goods declined 0.7% in December following the prior month’s strong increase.
- Consumer confidence improved modestly in February, rising to 91.2, as short-term outlook pessimism eased.
- Initial unemployment claims remain low at 212K, reinforcing the “low hire, no fire” labor narrative.

(as of Monday’s Market Opening)
| Total Return (1D) | Total Return (1W) | Total Return (MTD) | Total Return (QTD) | Total Return (YTD) | |
| S&P 500 | -0.43% | 0.60% | 0.00% | 0.49% | 0.49% |
| Dow Jones Industrial Average | -1.05% | 0.36% | 0.00% | 1.90% | 1.90% |
| NASDAQ | -0.92% | 0.18% | 0.00% | -2.47% | -2.47% |
| NASDAQ 100 | -0.30% | 1.02% | 0.00% | -1.15% | -1.15% |
| Russell 1000 | -0.48% | -0.46% | -0.58% | 0.76% | 0.76% |
| Russell 2000 | -1.72% | -1.21% | 0.68% | 6.20% | 6.20% |
| Russell 3000 | -0.52% | -0.51% | -0.51% | 0.98% | 0.98% |
| ACWI | -0.39% | -0.17% | 1.29% | 4.16% | 4.16% |
Global Client Survey
We’re inviting you to take part in a quick, anonymous client survey. Your feedback helps us fine-tune our process, elevate your experience, and ensure we’re delivering what matters most to you. This isn’t just about checking a box—it’s about shaping the future of how we serve you. Your voice helps guide our next steps. We’re listening. We’re learning. And we’re grateful for your trust.
Take Our Survey Now (click here)
Disclosures
- Wealth Mechanics™ is a registered trademark of Cestia Wealth Management. Unauthorized use of the trademark, including but not limited to commercial use, reproduction, or imitation without explicit written permission from Cestia Wealth Management, is strictly prohibited.
- Market commentary provided by NewEdge Advisors
- Charts concerning market data are provided by Exhibit A.
- Guides and other downloadable firm material respective to financial planning processes and data are provided and powered by fpPathfinder.
- Advisory services offered through NewEdge Advisors, LLC, a registered investment adviser. Securities offered through NewEdge Securities, LLC. Member FINRA/SIPC. NewEdge Advisors, LLC and NewEdge Securities, LLC are wholly owned subsidiaries of NewEdge Capital Group, LLC.
- Cestia Wealth Management is not a legal tax professional. We offer tax gap analysis for clients who desire to have a comprehensive financial plan, which requires in-depth tax strategy and planning as a distinct part of the overall customized solution. Please consult your tax professional on all matters addressed in this report.
- Information about annuities are not to be considered a recommendation. The information provided should not considered a recommendation to purchase or sell any particular security.
- Investing involves risk, including the potential loss of principal. No investment strategy can guarantee a profit or protect against loss in periods of declining values. Past performance is no guarantee of future results. Please note that individual situations can vary. Therefore, the information presented here should only be relied upon when coordinated with individual professional advice.
