



Week Ending August 14, 2026
The Scale of AI Infrastructure
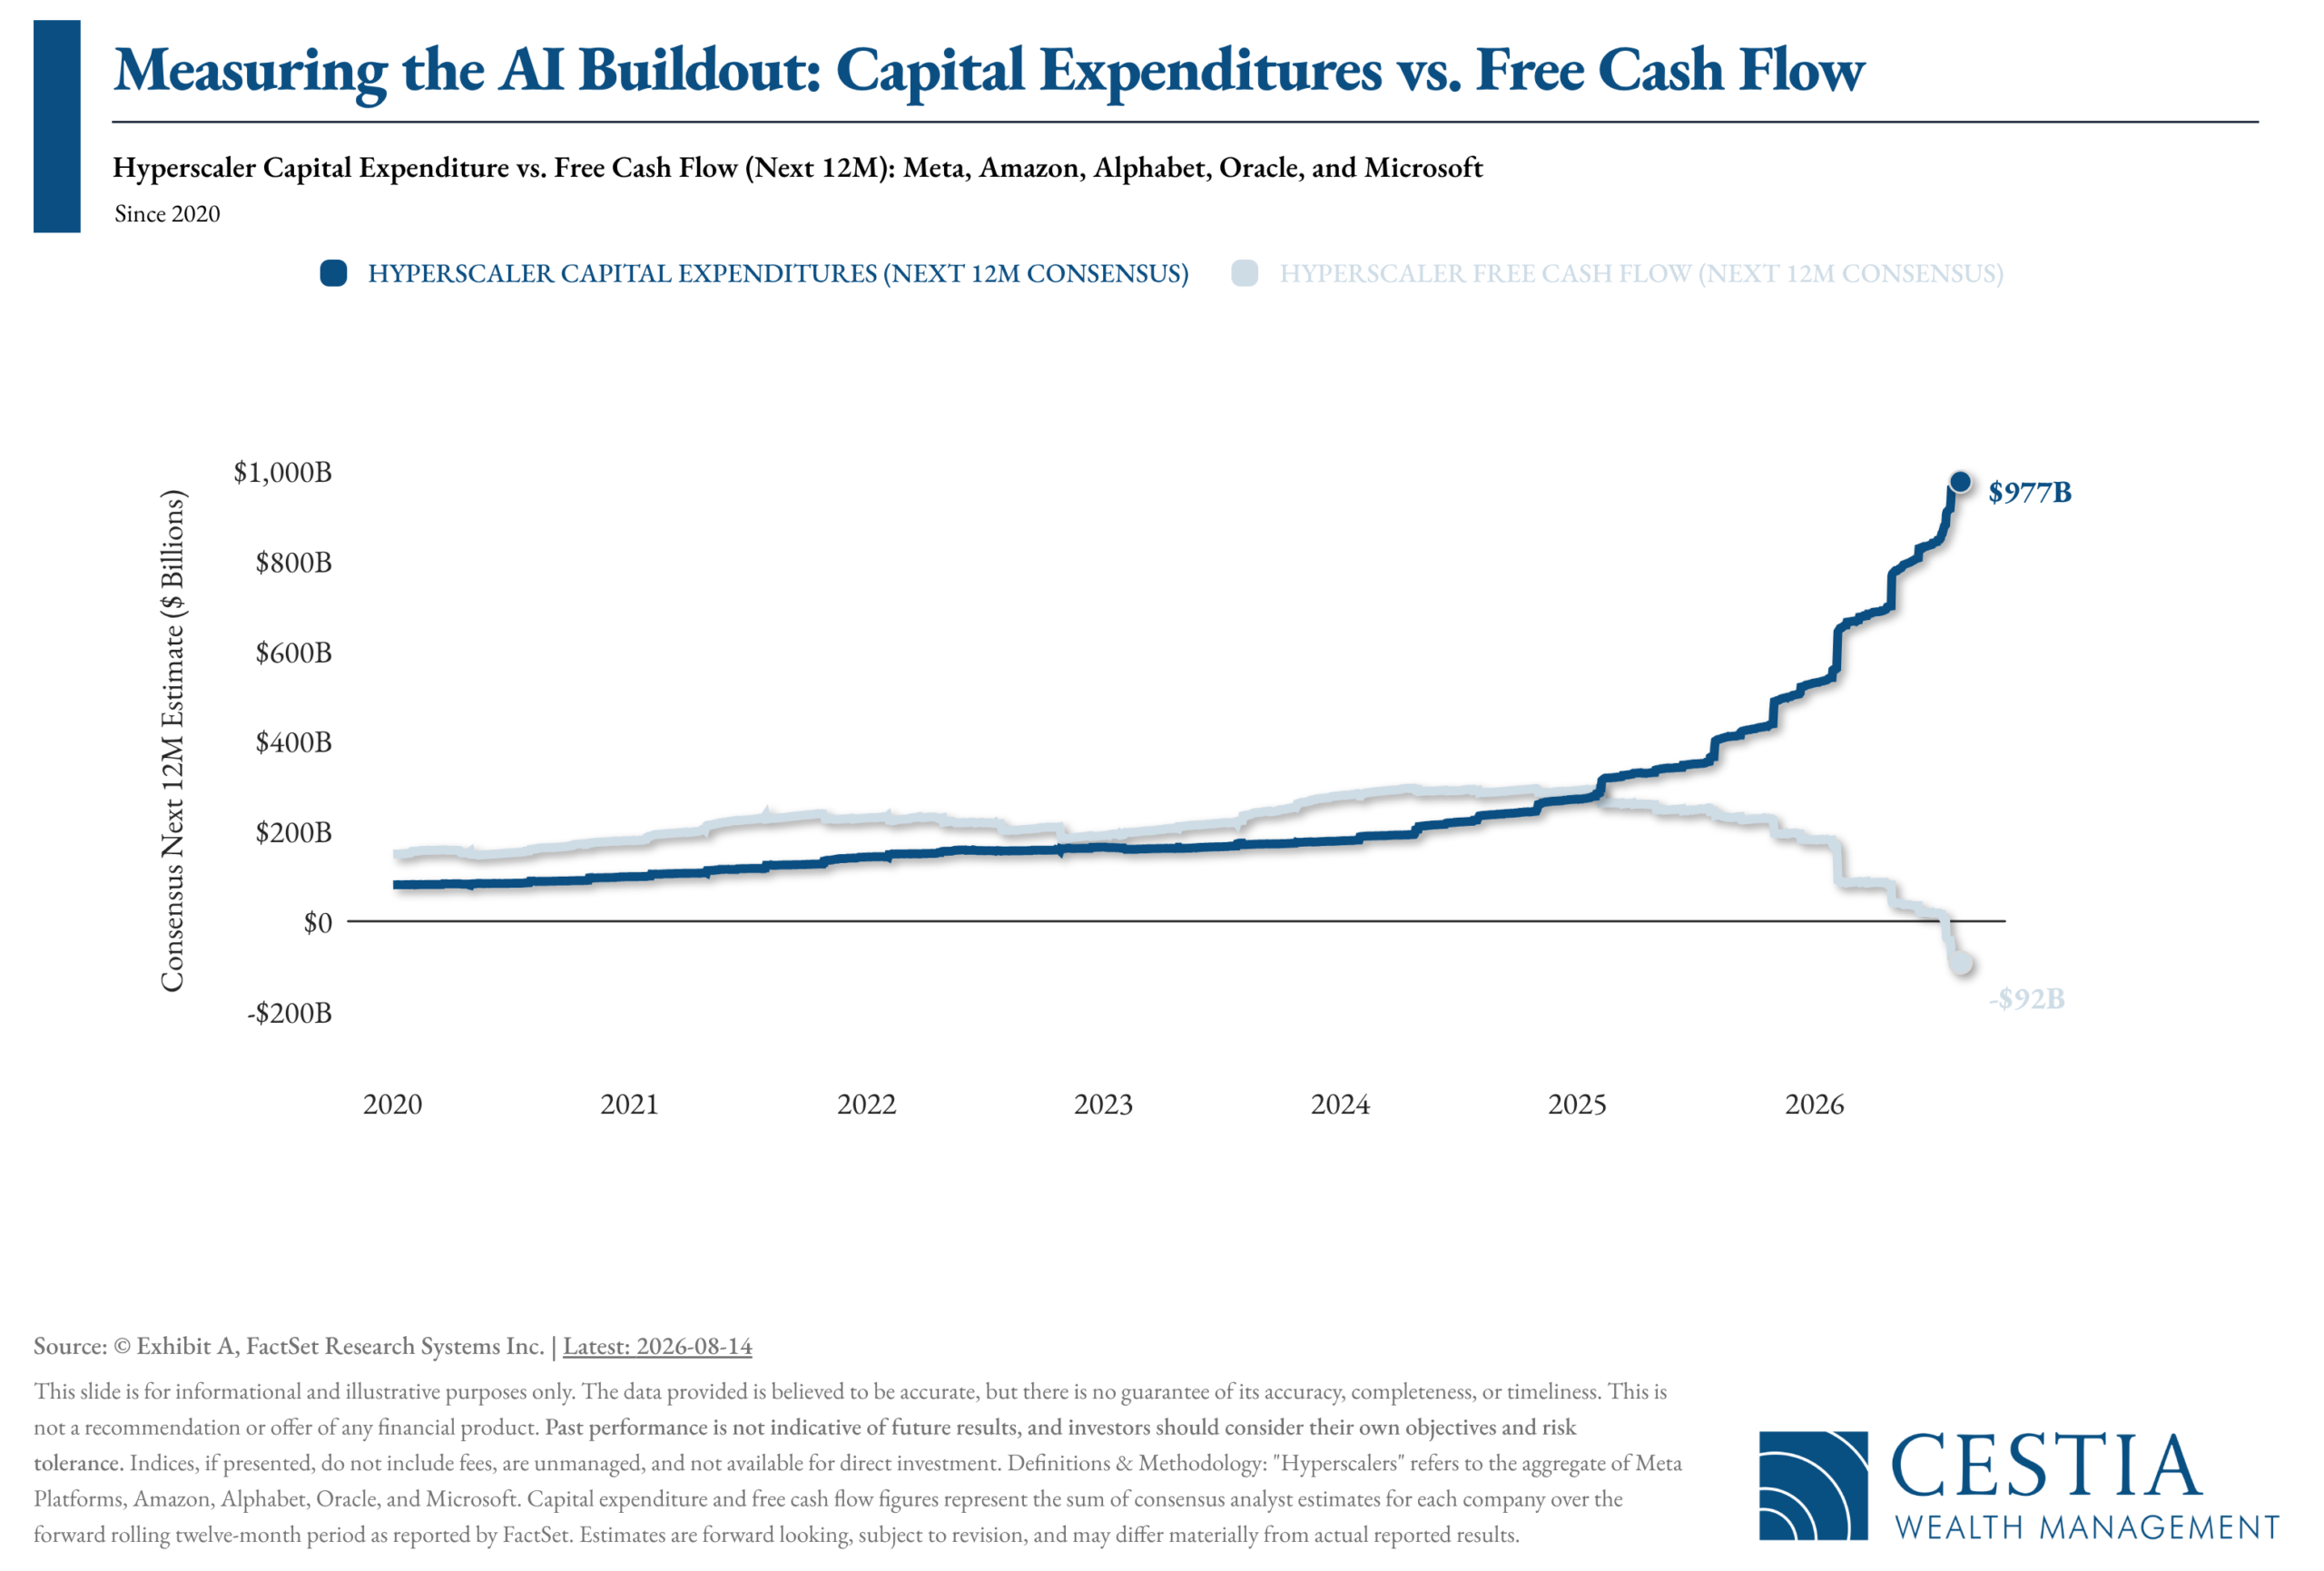
The scale of the AI infrastructure buildout becomes easier to appreciate when measured in cash. Rolling consensus estimates for the next twelve months point to approximately $977 billion in capital expenditures across the five largest hyperscalers, set against roughly negative $92 billion in free cash flow — a reminder that capital committed to infrastructure is capital unavailable for dividends, buybacks, debt reduction, or other purposes during the same period. Whether that spending converts into future earnings remains an open question.
The more consequential development for investors may be how it is being financed: as free cash flow turns negative, the buildout shifts from self-funded to dependent on debt and equity markets, introducing sensitivity to credit conditions and investor appetite alongside the underlying business risk. For clients, the practical consideration is not a verdict on these companies but an awareness of concentration. Given the weight these names carry in broad market indices, portfolio exposure to this single spending cycle may be larger than it appears.

The Future is for Everyone:The Path to a Positive AI Future
Claude content will soon get invisible AI watermarks
Sticky Inflation, Job Loss Prolong Fed’s Interest-Rate Limbo

What Issues Should I Consider When Harvesting Capital Losses?
Tax-loss harvesting is a popular strategy, but it’s not always clear whether it’s the right strategy for your needs. With our checklist, you will be better prepared to help your clients determine whether harvesting capital losses is appropriate for their financial situation.
This checklist covers some key issues to consider when a client and/or advisor are thinking of implementing a tax-loss harvesting strategy, such as:
- The effect harvesting losses may have on your overall portfolio goals.
- Some common pitfalls and rules to be aware of when harvesting losses.
- The potential tax benefits and consequences that may arise.
- How long-term goals may be affected by tax-loss harvesting.

A light week for economic and market news, with housing and manufacturing data on the docket. Corporate earnings from consumer-facing companies — Walmart (WMT), Home Depot (HD), and Target (TGT) — will be watched closely for a read on the health of the consumer.
Major equity indices continue to hover near all-time highs, boosted by a record-breaking earnings season. With investor positioning coming into the rally on the light side, recent strength appears to carry a “positioning chase” component as well. Notably, value-oriented indices (Russell 1000 Value, international developed, Europe, small caps) are trading stronger than their growth-oriented counterparts (Russell 1000 Growth, the Nasdaq, semiconductors, Korea).
In fixed income, last week’s softer inflation and retail sales data pushed short-term yields lower as the odds of an imminent Fed hike receded — yet long-term yields held near recent highs, steepening the curve, a dynamic NewEdge has dubbed the “Zoo Steepener.” This week’s notes include a primer on the yield curve and what drives it at different maturities.

(as of Monday’s Market Opening)
| Total Return (1D) | Total Return (1W) | Total Return (MTD) | Total Return (QTD) | Total Return (YTD) | |
| S&P 500 | -0.14% | 0.28% | 3.80% | 3.67% | 13.57% |
| Dow Jones Industrial Average | -0.29% | -0.74% | 2.08% | 2.40% | 11.47% |
| NASDAQ | -0.02% | 0.45% | 5.32% | 1.95% | 14.98% |
| NASDAQ 100 | -0.05% | 1.38% | 6.21% | -0.81% | 18.94% |
| Russell 1000 | -0.16% | 0.31% | 4.01% | 3.73% | 14.25% |
| Russell 2000 | -0.48% | 0.69% | 4.27% | 1.06% | 23.86% |
| Russell 3000 | -0.16% | 0.34% | 3.98% | 3.61% | 14.69% |
| ACWI | 0.04% | 0.56% | 3.78% | 3.43% | 15.49% |
Global Client Survey
We’re inviting you to take part in a quick, anonymous client survey. Your feedback helps us fine-tune our process, elevate your experience, and ensure we’re delivering what matters most to you. This isn’t just about checking a box—it’s about shaping the future of how we serve you. Your voice helps guide our next steps. We’re listening. We’re learning. And we’re grateful for your trust.
Take Our Survey Now (click here)
Disclosures
- Wealth Mechanics™ is a registered trademark of Cestia Wealth Management. Unauthorized use of the trademark, including but not limited to commercial use, reproduction, or imitation without explicit written permission from Cestia Wealth Management, is strictly prohibited.
- Market commentary provided by NewEdge Advisors
- Charts concerning market data are provided by Exhibit A.
- Guides and other downloadable firm material respective to financial planning processes and data are provided and powered by fpPathfinder.
- Advisory services offered through NewEdge Advisors, LLC, a registered investment adviser. Securities offered through NewEdge Securities, LLC. Member FINRA/SIPC. NewEdge Advisors, LLC and NewEdge Securities, LLC are wholly owned subsidiaries of NewEdge Capital Group, LLC.
- Cestia Wealth Management is not a legal tax professional. We offer tax gap analysis for clients who desire to have a comprehensive financial plan, which requires in-depth tax strategy and planning as a distinct part of the overall customized solution. Please consult your tax professional on all matters addressed in this report.
- Information about annuities are not to be considered a recommendation. The information provided should not considered a recommendation to purchase or sell any particular security.
- Investing involves risk, including the potential loss of principal. No investment strategy can guarantee a profit or protect against loss in periods of declining values. Past performance is no guarantee of future results. Please note that individual situations can vary. Therefore, the information presented here should only be relied upon when coordinated with individual professional advice.
