



Week Ending August 21, 2026
The Interest Burden in Context
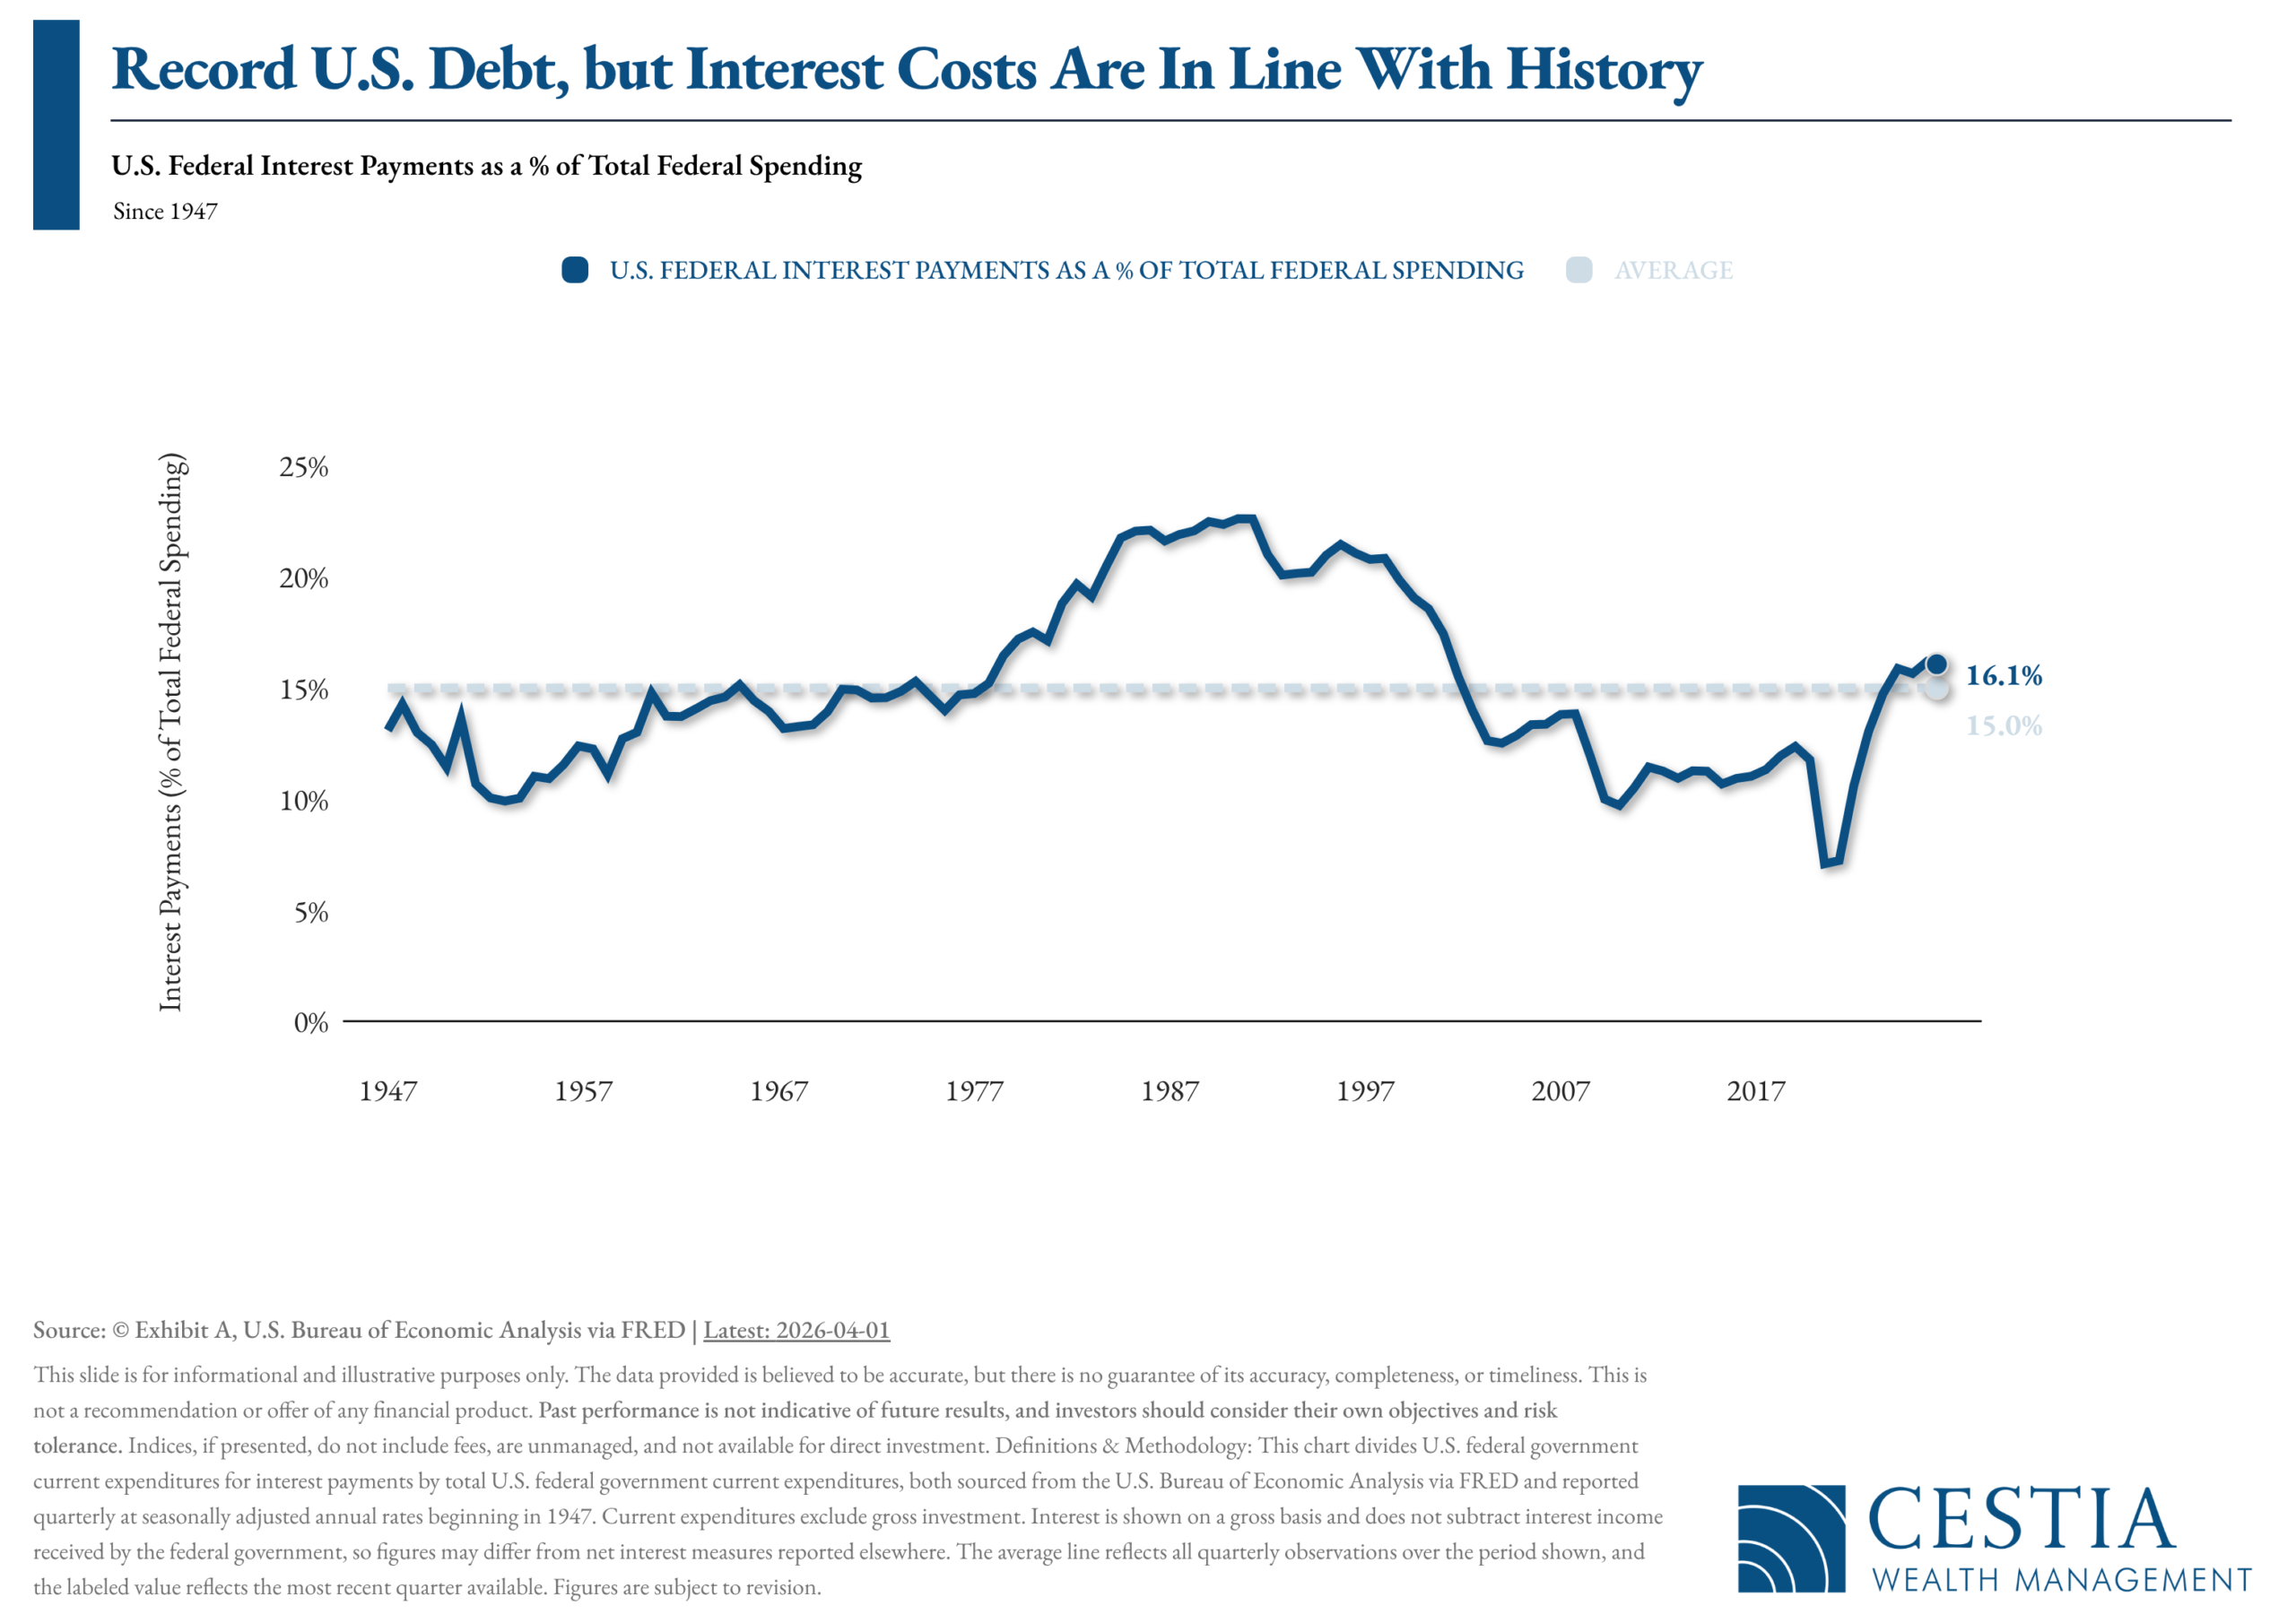
This week’s chart looks at the federal debt from a different angle than the headline dollar figure. Rather than tracking the total amount owed, it measures federal interest payments as a share of everything the federal government spends — the portion of each budget dollar consumed by servicing past borrowing rather than funding current programs.
By that measure, interest payments currently absorb 16.1% of federal spending, compared with a long-term average of 15.0% dating back to 1947. The debt itself has continued to set records. The interest burden, framed as a share of total spending, has not.
Investment implications: The distinction matters for how investors interpret fiscal headlines. A record debt balance and a record interest burden are not the same claim, and conflating them can lead to portfolio decisions built on the wrong premise. The interest burden reflects both how much is owed and the rate at which it is financed — which is why the level of interest rates, and not the debt balance alone, drives the cost. For long-term investors, the practical takeaway is to keep fiscal developments in proportion: they are a legitimate input to duration and diversification decisions, but a poor basis for wholesale changes to a plan.


Putting a Number on the Cost of Waiting: Capital Gains Tax Deferral Calculator
Few decisions in financial planning generate more hesitation than selling an appreciated holding. A position purchased years ago at a fraction of its current price carries an embedded tax bill, and the instinct to avoid that bill often quietly overrides the question of whether the position still belongs in the portfolio at its current size. Fidelity’s Capital Gains Tax Deferral Calculator is designed to replace that instinct with arithmetic. The tool compares the potential benefits of diversifying a concentrated position on a tax-deferred basis against simply selling the position and reinvesting the after-tax proceeds — which is to say, it puts a number on both sides of a tradeoff that most investors evaluate on feel alone. Fidelity Institutional
Running the calculation matters because the answer is not intuitive, and it changes with the inputs. A large embedded gain, a long remaining time horizon, and a high marginal rate all argue for patience. A holding that has grown to dominate a portfolio, a near-term liquidity need, a coming change in tax bracket, or a heightened concentration risk all argue for acting sooner. Because those factors push in opposite directions, the same holding can warrant opposite conclusions in two different households — and the only way to know which applies is to model it.
The calculator is most useful when it is pointed at a specific question rather than run in the abstract. It can help frame decisions such as: How much of this position can I diversify this year without moving into a higher bracket? If I hold rather than sell, how large does the expected return advantage need to be to justify the concentration risk I am carrying? Does spreading the sale across several tax years produce a materially better result than a single transaction? And how does the calculus shift if the position is intended for heirs or for charitable giving, where the tax treatment may differ entirely?
If you hold a concentrated or highly appreciated position, we would encourage you to raise it at your next review. We can run this analysis alongside your broader plan, so the tax consequence is weighed against your allocation targets, income needs, and estate objectives rather than considered in isolation. Deferral is a legitimate strategy. It is simply not a free one, and the purpose of the calculation is to know what it costs.

Markets head into the final week of August with a full macro and earnings docket. Investors will parse July Personal Consumption Expenditures data — covering inflation, spending, and income — for further signals on the disinflation path, while also digesting fiscal second-quarter earnings from Nvidia (NVDA), the S&P 500’s largest constituent, in a report that could meaningfully shape sentiment around the AI trade. Fed Chair Warsh is scheduled to deliver his first keynote address at the Jackson Hole Economic Symposium, a speech markets will be parsing closely for policy signals; notably, there is no summer Friday this week, so investors will be positioned for his remarks in real time.
These catalysts converge with seasonal headwinds that have historically weighed on risk assets and with typically lighter late-August trading volumes, a combination that has the potential to amplify volatility across equity, bond, currency, and commodity markets. This week’s research also revisits last week’s Treasury buyback announcement and the resulting volatility in long-dated bonds, alongside what historically strong economic data — such as last week’s Philly Fed manufacturing report — has tended to signal for equity markets going forward.

(as of Monday’s Market Opening)
| Total Return (1D) | Total Return (1W) | Total Return (MTD) | Total Return (QTD) | Total Return (YTD) | |
| S&P 500 | 0.43% | -0.91% | 2.47% | 2.33% | 12.11% |
| Dow Jones Industrial Average | 0.98% | -0.34% | 1.51% | 1.83% | 10.85% |
| NASDAQ | 0.43% | -1.74% | 3.18% | -0.13% | 12.64% |
| NASDAQ 100 | 0.33% | -2.29% | 3.66% | -3.20% | 16.08% |
| Russell 1000 | 0.43% | -1.35% | 2.77% | 2.49% | 12.89% |
| Russell 2000 | 0.77% | -1.68% | 3.01% | -0.16% | 22.36% |
| Russell 3000 | 0.43% | -1.36% | 2.73% | 2.36% | 13.31% |
| ACWI | 0.53% | -0.91% | 2.80% | 2.45% | 14.39% |
Global Client Survey
We’re inviting you to take part in a quick, anonymous client survey. Your feedback helps us fine-tune our process, elevate your experience, and ensure we’re delivering what matters most to you. This isn’t just about checking a box—it’s about shaping the future of how we serve you. Your voice helps guide our next steps. We’re listening. We’re learning. And we’re grateful for your trust.
Take Our Survey Now (click here)
Disclosures
- Wealth Mechanics™ is a registered trademark of Cestia Wealth Management. Unauthorized use of the trademark, including but not limited to commercial use, reproduction, or imitation without explicit written permission from Cestia Wealth Management, is strictly prohibited.
- Market commentary provided by NewEdge Advisors
- Charts concerning market data are provided by Exhibit A.
- Guides and other downloadable firm material respective to financial planning processes and data are provided and powered by fpPathfinder.
- Advisory services offered through NewEdge Advisors, LLC, a registered investment adviser. Securities offered through NewEdge Securities, LLC. Member FINRA/SIPC. NewEdge Advisors, LLC and NewEdge Securities, LLC are wholly owned subsidiaries of NewEdge Capital Group, LLC.
- Cestia Wealth Management is not a legal tax professional. We offer tax gap analysis for clients who desire to have a comprehensive financial plan, which requires in-depth tax strategy and planning as a distinct part of the overall customized solution. Please consult your tax professional on all matters addressed in this report.
- Information about annuities are not to be considered a recommendation. The information provided should not considered a recommendation to purchase or sell any particular security.
- Investing involves risk, including the potential loss of principal. No investment strategy can guarantee a profit or protect against loss in periods of declining values. Past performance is no guarantee of future results. Please note that individual situations can vary. Therefore, the information presented here should only be relied upon when coordinated with individual professional advice.
