



August 1, 2025
WEEKLY TOUCHPOINT
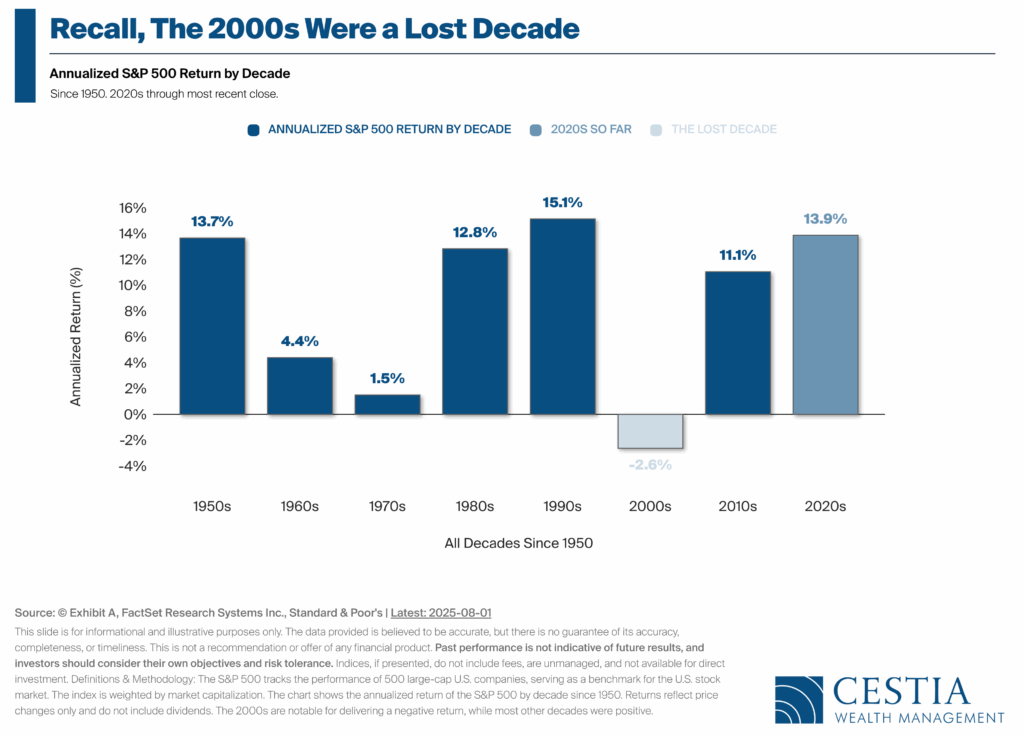
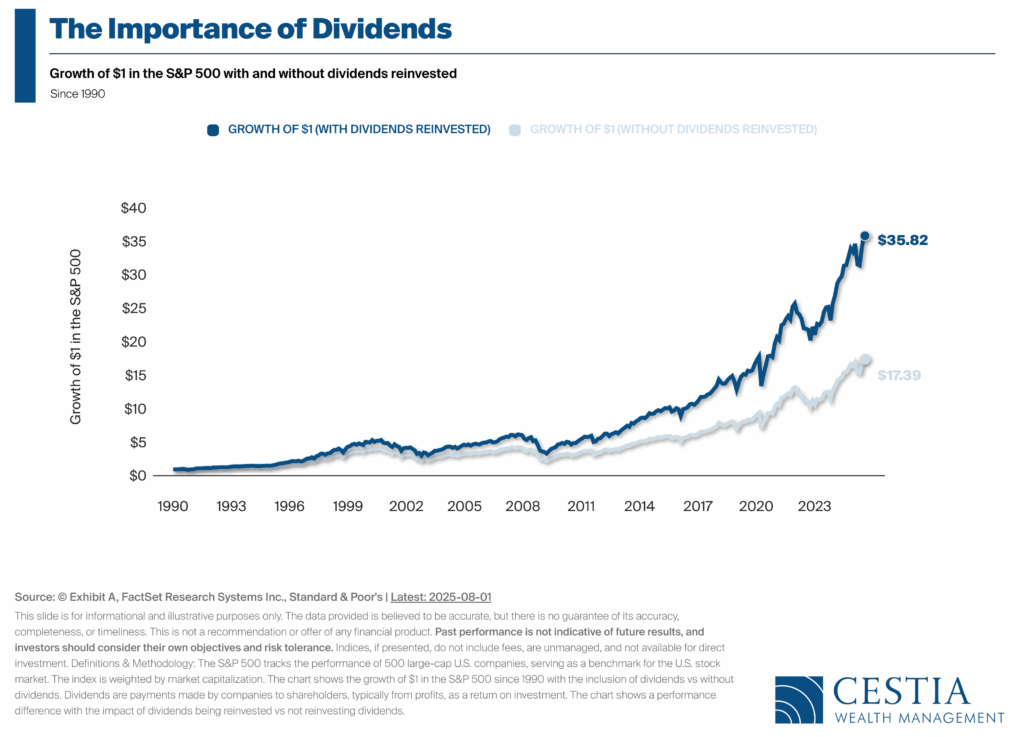
The 2000s serve as a sobering reminder that even full decades can deliver disappointing results for investors—the S&P 500 posted a negative annualized return of -2.6%, weighed down by the dot-com crash and the Great Financial Crisis. This uneven stretch underscores a core truth of investing: long-term growth is not always a straight line. But zooming out, the data also reveals a powerful insight—dividends matter, a lot. Since 1990, a $1 investment in the S&P 500 grew to $35.82 with dividends reinvested, versus just $17.39 without. That’s the compounding engine at work. For those focused on building wealth over time, reinvesting dividends and staying the course—especially during tough stretches like the 2000s—can dramatically improve outcomes and help turn market volatility into long-term opportunity.
NEWS
Wealth Mechanics™
Unlocking Tax Savings with a Little-Known Gifting Strategy
If you own stock with massive gains but can’t stomach the tax bill from selling, a creative solution might lie one generation up. A strategy known as “upstream gifting” could help your family sidestep capital gains taxes by gifting appreciated stock to a parent or older relative. Here’s the magic: if that person holds the stock until their passing, your family receives a full step-up in cost basis, effectively erasing the capital gains tax—no sale required.
This move isn’t for everyone, but for the right family, it could be a tax-smart game changer. It requires:
- Gifting the asset while the recipient is alive and likely to outlive the 1-year IRS holding rule.
- Updated estate documents to ensure the stock passes to your intended heir.
- Clear communication and trust—especially if Grandpa finds a new love interest or racks up medical bills.
Other options for reducing gains tax on concentrated stock include charitable gifts, Section 351 conversions, or variable prepaid forwards. But upstream gifting stands out for its simplicity—if you plan it right.
DOWNLOAD ARTICLE
Source: Financial-Planning.com
MARKET COMMENTARY
Equities: A Week of Reversal
-
U.S. stocks took a breather from record highs as tariff tensions and tepid economic news clipped market enthusiasm.
-
President Trump’s August 1 executive order to raise tariffs weighed on sentiment, especially heading into the weekend.
-
Despite a choppy week, earnings season impressed: 82% of S&P 500 companies beat estimates, driving a strong 10.3% growth rate.
-
Smaller companies lagged while growth stocks led value. Only utilities and communication services finished the week in positive territory.
-
Overseas markets mirrored the U.S. sell-off, with developed and emerging markets both ending in the red.
Bonds: Rally Mode on Caution
-
Bonds found their footing as weaker economic data and rate-cut hopes sparked a rally, particularly in long-duration Treasuries.
-
The 2-year Treasury yield dropped to 3.69% (down 25 bps), while the 10-year settled at 4.23%.
-
Investment-grade bond yields declined to 4.95%, while high-yield rose to 7.38%, reflecting increased risk aversion.
-
Overall, high-quality and longer-dated bonds were the week’s standouts.
Macroeconomic Data: Clouds on the Horizon
-
Friday’s jobs report disappointed, with only 73,000 new jobs added and prior months revised significantly lower.
-
Consumer confidence inched higher in July, largely driven by more optimistic expectations.
-
Q2 GDP came in at a healthy 3%, bolstered by falling imports—a bright spot amid softness elsewhere.
-
Inflation ticked up with June’s PCE rising 0.3%, lifting the annual rate to 2.6% as tariffs began to bite.
-
ISM Manufacturing slumped further into contraction at 48.0%, its fifth month below 50.
INDEX RETURNS
(as of Monday’s Market Opening)
| Total Return (1D) | Total Return (1W) | Total Return (MTD) | Total Return (QTD) | Total Return (YTD) | |
| S&P 500 |
1.12% |
-1.28% | -0.50% | 1.66% |
7.25% |
| Dow Jones Industrial Average |
0.91% |
-1.90% | -0.33% | -0.25% |
3.39% |
| NASDAQ |
1.48% |
-1.06% | -0.79% | 2.87% |
8.52% |
| NASDAQ 100 |
1.62% |
-0.96% | -0.37% | 2.00% |
10.09% |
| Russell 1000 |
-1.64% |
-2.42% | -1.64% | 0.55% |
6.70% |
| Russell 2000 |
0.86% |
-3.42% | -1.30% | 0.40% |
-2.08% |
| Russell 3000 |
1.04% |
-1.46% | -0.61% | 1.64% |
7.29% |
| ACWI |
1.11% |
-1.62% | -0.17% | 0.88% |
11.27% |
Source: MorningStar
Global Client Survey
We’re inviting you to take part in a quick, anonymous client survey. Your feedback helps us fine-tune our process, elevate your experience, and ensure we’re delivering what matters most to you. This isn’t just about checking a box—it’s about shaping the future of how we serve you. Your voice helps guide our next steps. We’re listening. We’re learning. And we’re grateful for your trust.
Take Our Survey Now (click here)
Disclosures
- Wealth Mechanics™ is a registered trademark of Cestia Wealth Management. Unauthorized use of the trademark, including but not limited to commercial use, reproduction, or imitation without explicit written permission from Cestia Wealth Management, is strictly prohibited.
- Market commentary provided by NewEdge Advisors
- Charts concerning market data are provided by Exhibit A.
- Guides and other downloadable firm material respective to financial planning processes and data are provided and powered by fpPathfinder.
- Advisory services offered through NewEdge Advisors, LLC, a registered investment adviser. Securities offered through NewEdge Securities, LLC. Member FINRA/SIPC. NewEdge Advisors, LLC and NewEdge Securities, LLC are wholly owned subsidiaries of NewEdge Capital Group, LLC.
- Cestia Wealth Management is not a legal tax professional. We offer tax gap analysis for clients who desire to have a comprehensive financial plan, which requires in-depth tax strategy and planning as a distinct part of the overall customized solution. Please consult your tax professional on all matters addressed in this report.
- Information about annuities are not to be considered a recommendation. The information provided should not considered a recommendation to purchase or sell any particular security.
- Investing involves risk, including the potential loss of principal. No investment strategy can guarantee a profit or protect against loss in periods of declining values. Past performance is no guarantee of future results. Please note that individual situations can vary. Therefore, the information presented here should only be relied upon when coordinated with individual professional advice.
