



October 3, 2025
WEEKLY TOUCHPOINT
When Politics Pause, Markets Keep Moving
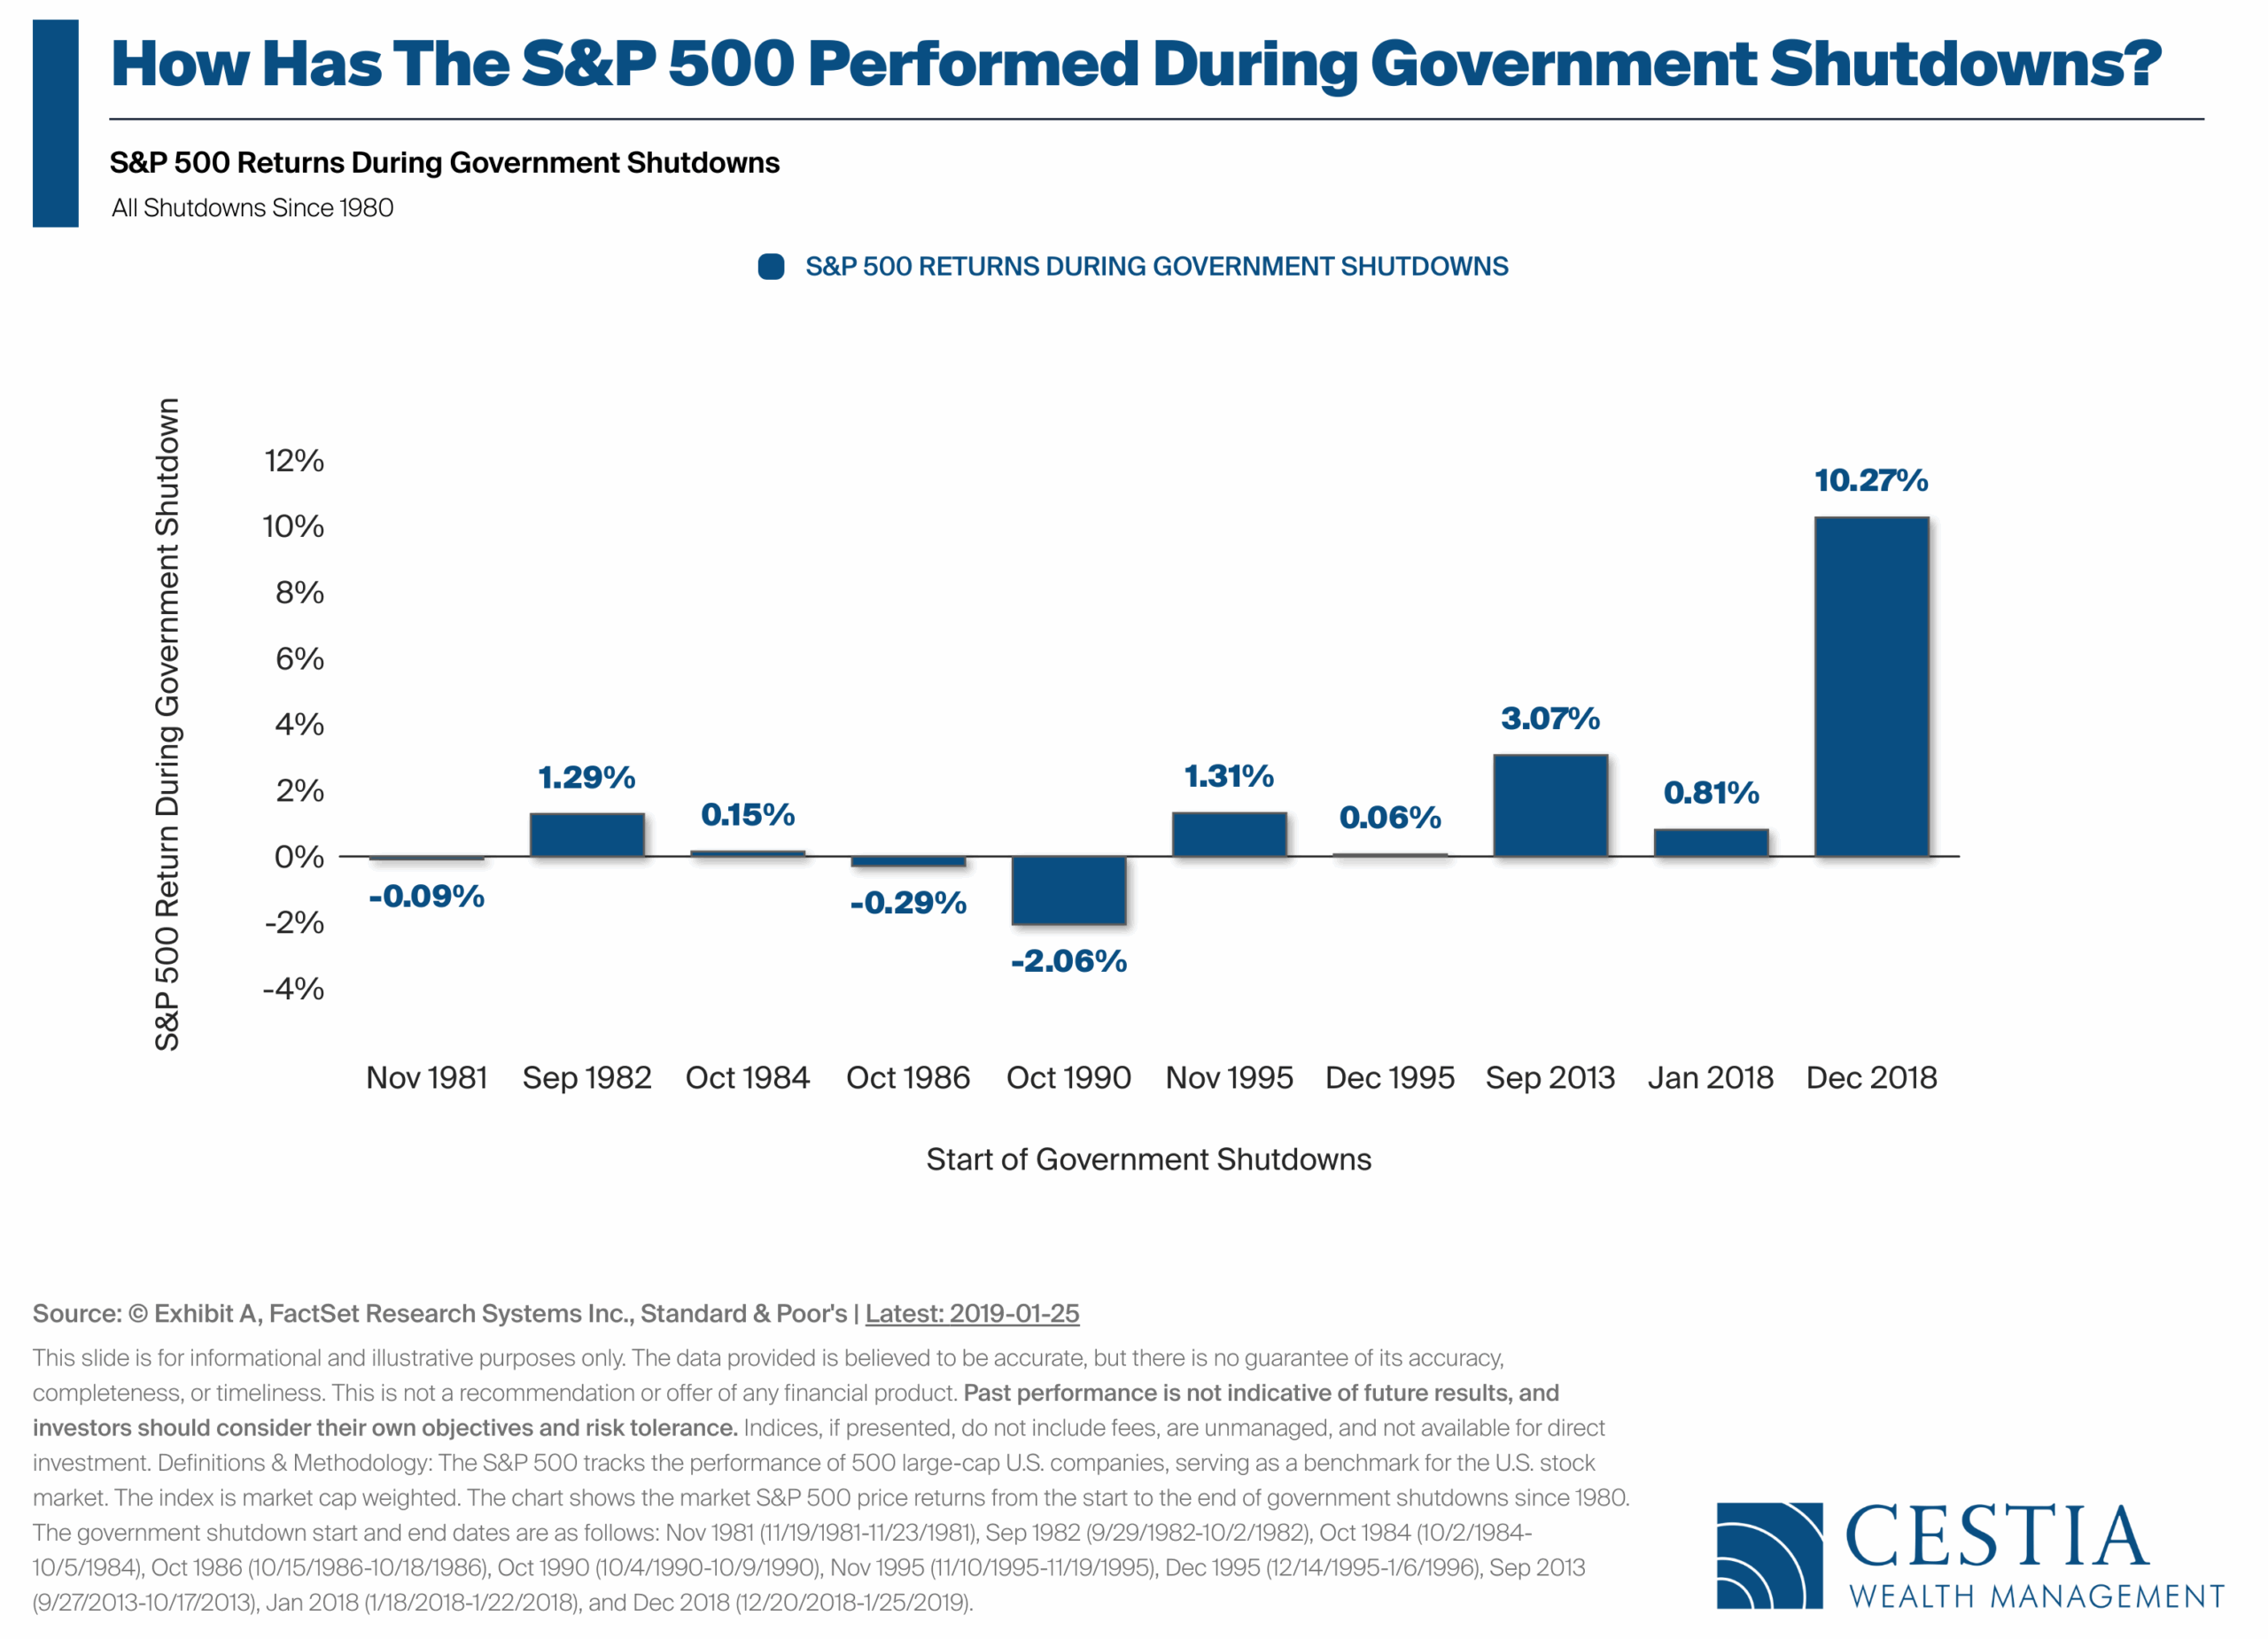
Government shutdowns make for dramatic headlines, but the data tells a calmer story. Our featured chart this week tracks how the S&P 500 has behaved during past shutdowns — and the takeaway may surprise you.
-
Understanding the Data: Despite the headlines, markets have shown resilience. Since 1980, the S&P 500’s performance during shutdowns has ranged widely, reflecting that investors often price in uncertainty well in advance.
-
A Look at the Numbers: In 7 of the past 10 shutdowns, the S&P 500 actually posted positive returns — a reminder that even in Washington gridlock, markets often keep climbing.
-
Investment Implications: Political noise rarely alters long-term fundamentals. History shows that patience and perspective tend to outperform panic and prediction.
In short — while Congress debates, disciplined investors stay the course.

- The federal government has officially shut down
-
Surprisingly Grim Jobs Data May Accelerate Fed Interest Rate Cuts

Turning Education Savings into Retirement Growth: The 529-to-Roth IRA Transfer
A new rule from the SECURE Act 2.0 has opened an intriguing door: the ability to transfer unused 529 plan funds into a Roth IRA. It’s a creative way to repurpose education savings into long-term wealth — but there are a few key checkpoints before making the move.
This guide helps you determine whether you (or your clients) are eligible and if this strategy makes sense for your broader financial plan. Here’s what to keep in mind:
-
Time Matters: The 529 plan must have been open and funded for at least 15 years before any transfer can take place.
-
Right Names, Right Accounts: The Roth IRA must belong to the same beneficiary listed on the 529 plan.
-
Income and Limits Apply: Earned income, prior Roth contributions, and the lifetime 529-to-Roth transfer cap (currently $35,000) all come into play.
-
Strategic Fit: Even if eligible, it’s important to weigh whether converting education savings into retirement assets aligns with your long-term goals.
This new option gives savers flexibility — turning dollars once earmarked for college into fuel for future financial independence.
Source: fp Pathfinder

Equities:
-
The S&P 500 notched a new all-time high even as the U.S. government entered a shutdown.
-
Optimism grew that the Federal Reserve may cut rates in October following weaker labor data.
-
Small-cap and growth stocks led the week’s gains, while 6 of 11 S&P sectors traded higher.
-
Healthcare was the standout, rallying nearly 7% as investors rotated into previously lagging sectors.
-
Foreign equities outperformed U.S. markets, helped by a weaker dollar and renewed global interest.
Bonds:
-
Treasury yields fell as soft economic data boosted bond prices across the curve.
-
The 2-year yield declined to 3.58% and the 10-year to 4.13%, narrowing the spread slightly to 0.55%.
-
Longer-duration bonds outperformed, with strength in investment-grade corporates and Treasuries.
-
Yields on investment-grade and high-yield bonds eased to 4.79% and 7.05%, respectively.
Macroeconomic Data:
-
Key reports like non-farm payrolls were delayed due to the shutdown, shifting attention to ADP and JOLTS.
-
ADP data showed a loss of 32,000 private-sector jobs, while job openings held steady at 7.2 million.
-
ISM Manufacturing stayed in contraction at 49.1%, while ISM Services slipped to 50.0%.
-
Global PMI readings softened slightly, though business optimism climbed to a seven-month high

(as of Monday’s Market Opening)
| Total Return (1D) | Total Return (1W) | Total Return (MTD) | Total Return (QTD) | Total Return (YTD) | |
| S&P 500 | 0.27% | 1.09% | 0.68% | 0.68% | 14.49% |
| Dow Jones Industrial Average | -0.21% | 0.75% | 0.57% | 0.57% | 9.68% |
| NASDAQ | 0.39% | 1.23% | 0.92% | 0.92% | 18.42% |
| NASDAQ 100 | 0.68% | 1.39% | 1.11% | 1.11% | 18.76% |
| Russell 1000 | 0.22% | 1.03% | 0.76% | 0.76% | 15.21% |
| Russell 2000 | 0.80% | 2.55% | 2.41% | 2.41% | 13.02% |
| Russell 3000 | 0.27% | 1.32% | 0.75% | 0.75% | 15.11% |
| ACWI | 0.31% | 1.89% | 1.22% | 1.22% | 20.01% |

Through the Eyes of a Buyer: 54 Value Factors That Drive Business Worth
When it comes to selling a business, price is only part of the equation. Sophisticated buyers look far beyond revenue and profit—they evaluate dozens of qualitative and quantitative drivers that determine whether a company is truly transferable and sustainable without the owner.
The Exit Planning Institute identifies 54 key value factors that influence how buyers perceive your business across six broad categories:
-
Personal Factors: The owner’s age, motivation, attitude, and alignment among family or partners. Buyers want confidence that the owner is committed to transitioning and that key stakeholders agree on the exit plan.
-
Business Operations: Management depth, customer concentration, sales processes, and scalability. Businesses overly reliant on the owner or a few customers are seen as high risk.
-
Industry Factors: Market trends, competitive position, and barriers to entry—all of which impact long-term growth potential.
-
Legal and Regulatory Factors: Compliance, contracts, and exposure to litigation directly affect deal certainty and valuation.
-
Financial Factors: Quality of earnings, reliable reporting, and consistent cash flow stability determine buyer confidence.
-
Economic and M&A Market Factors: Timing, market cycles, and access to capital influence whether now is a favorable environment to sell.
Most owners discover that many of these factors are “opportunities for improvement.” The good news? Each represents a controllable lever that can enhance your company’s attractiveness and readiness—key metrics in the Value Acceleration Methodology™.
At Cestia Wealth, we help owners quantify and strengthen these drivers through our Business Readiness Scorecard, turning hidden risk into measurable value.
SOURCE: The Exit Planning Institute
Global Client Survey
We’re inviting you to take part in a quick, anonymous client survey. Your feedback helps us fine-tune our process, elevate your experience, and ensure we’re delivering what matters most to you. This isn’t just about checking a box—it’s about shaping the future of how we serve you. Your voice helps guide our next steps. We’re listening. We’re learning. And we’re grateful for your trust.
Take Our Survey Now (click here)
Disclosures
- Wealth Mechanics™ is a registered trademark of Cestia Wealth Management. Unauthorized use of the trademark, including but not limited to commercial use, reproduction, or imitation without explicit written permission from Cestia Wealth Management, is strictly prohibited.
- Market commentary provided by NewEdge Advisors
- Charts concerning market data are provided by Exhibit A.
- Guides and other downloadable firm material respective to financial planning processes and data are provided and powered by fpPathfinder.
- Advisory services offered through NewEdge Advisors, LLC, a registered investment adviser. Securities offered through NewEdge Securities, LLC. Member FINRA/SIPC. NewEdge Advisors, LLC and NewEdge Securities, LLC are wholly owned subsidiaries of NewEdge Capital Group, LLC.
- Cestia Wealth Management is not a legal tax professional. We offer tax gap analysis for clients who desire to have a comprehensive financial plan, which requires in-depth tax strategy and planning as a distinct part of the overall customized solution. Please consult your tax professional on all matters addressed in this report.
- Information about annuities are not to be considered a recommendation. The information provided should not considered a recommendation to purchase or sell any particular security.
- Investing involves risk, including the potential loss of principal. No investment strategy can guarantee a profit or protect against loss in periods of declining values. Past performance is no guarantee of future results. Please note that individual situations can vary. Therefore, the information presented here should only be relied upon when coordinated with individual professional advice.
