



September 12, 2025
WEEKLY TOUCHPOINT
Lately, questions concerning an “AI bubble” have circulated. Coincidentally, many of our clients have questioned whether they should revisit their investment strategy and reallocate their portfolio away from the leaders who have garnered large concentrations on the S&P 500 index.. The answer: maybe.
First, aligning your portfolio with your financial goals is paramount. Second, understanding how your portfolio measures against the benchmark for your goals is also critical. This step requires some basic understanding of assets, such as large-cap stocks and small-cap stocks, for instance.
Once this subject is poked, the following question typically arises: What assets should I hold; large-cap or small-cap stocks? Which ones have performed better? That is a great question, so let’s start there this week.
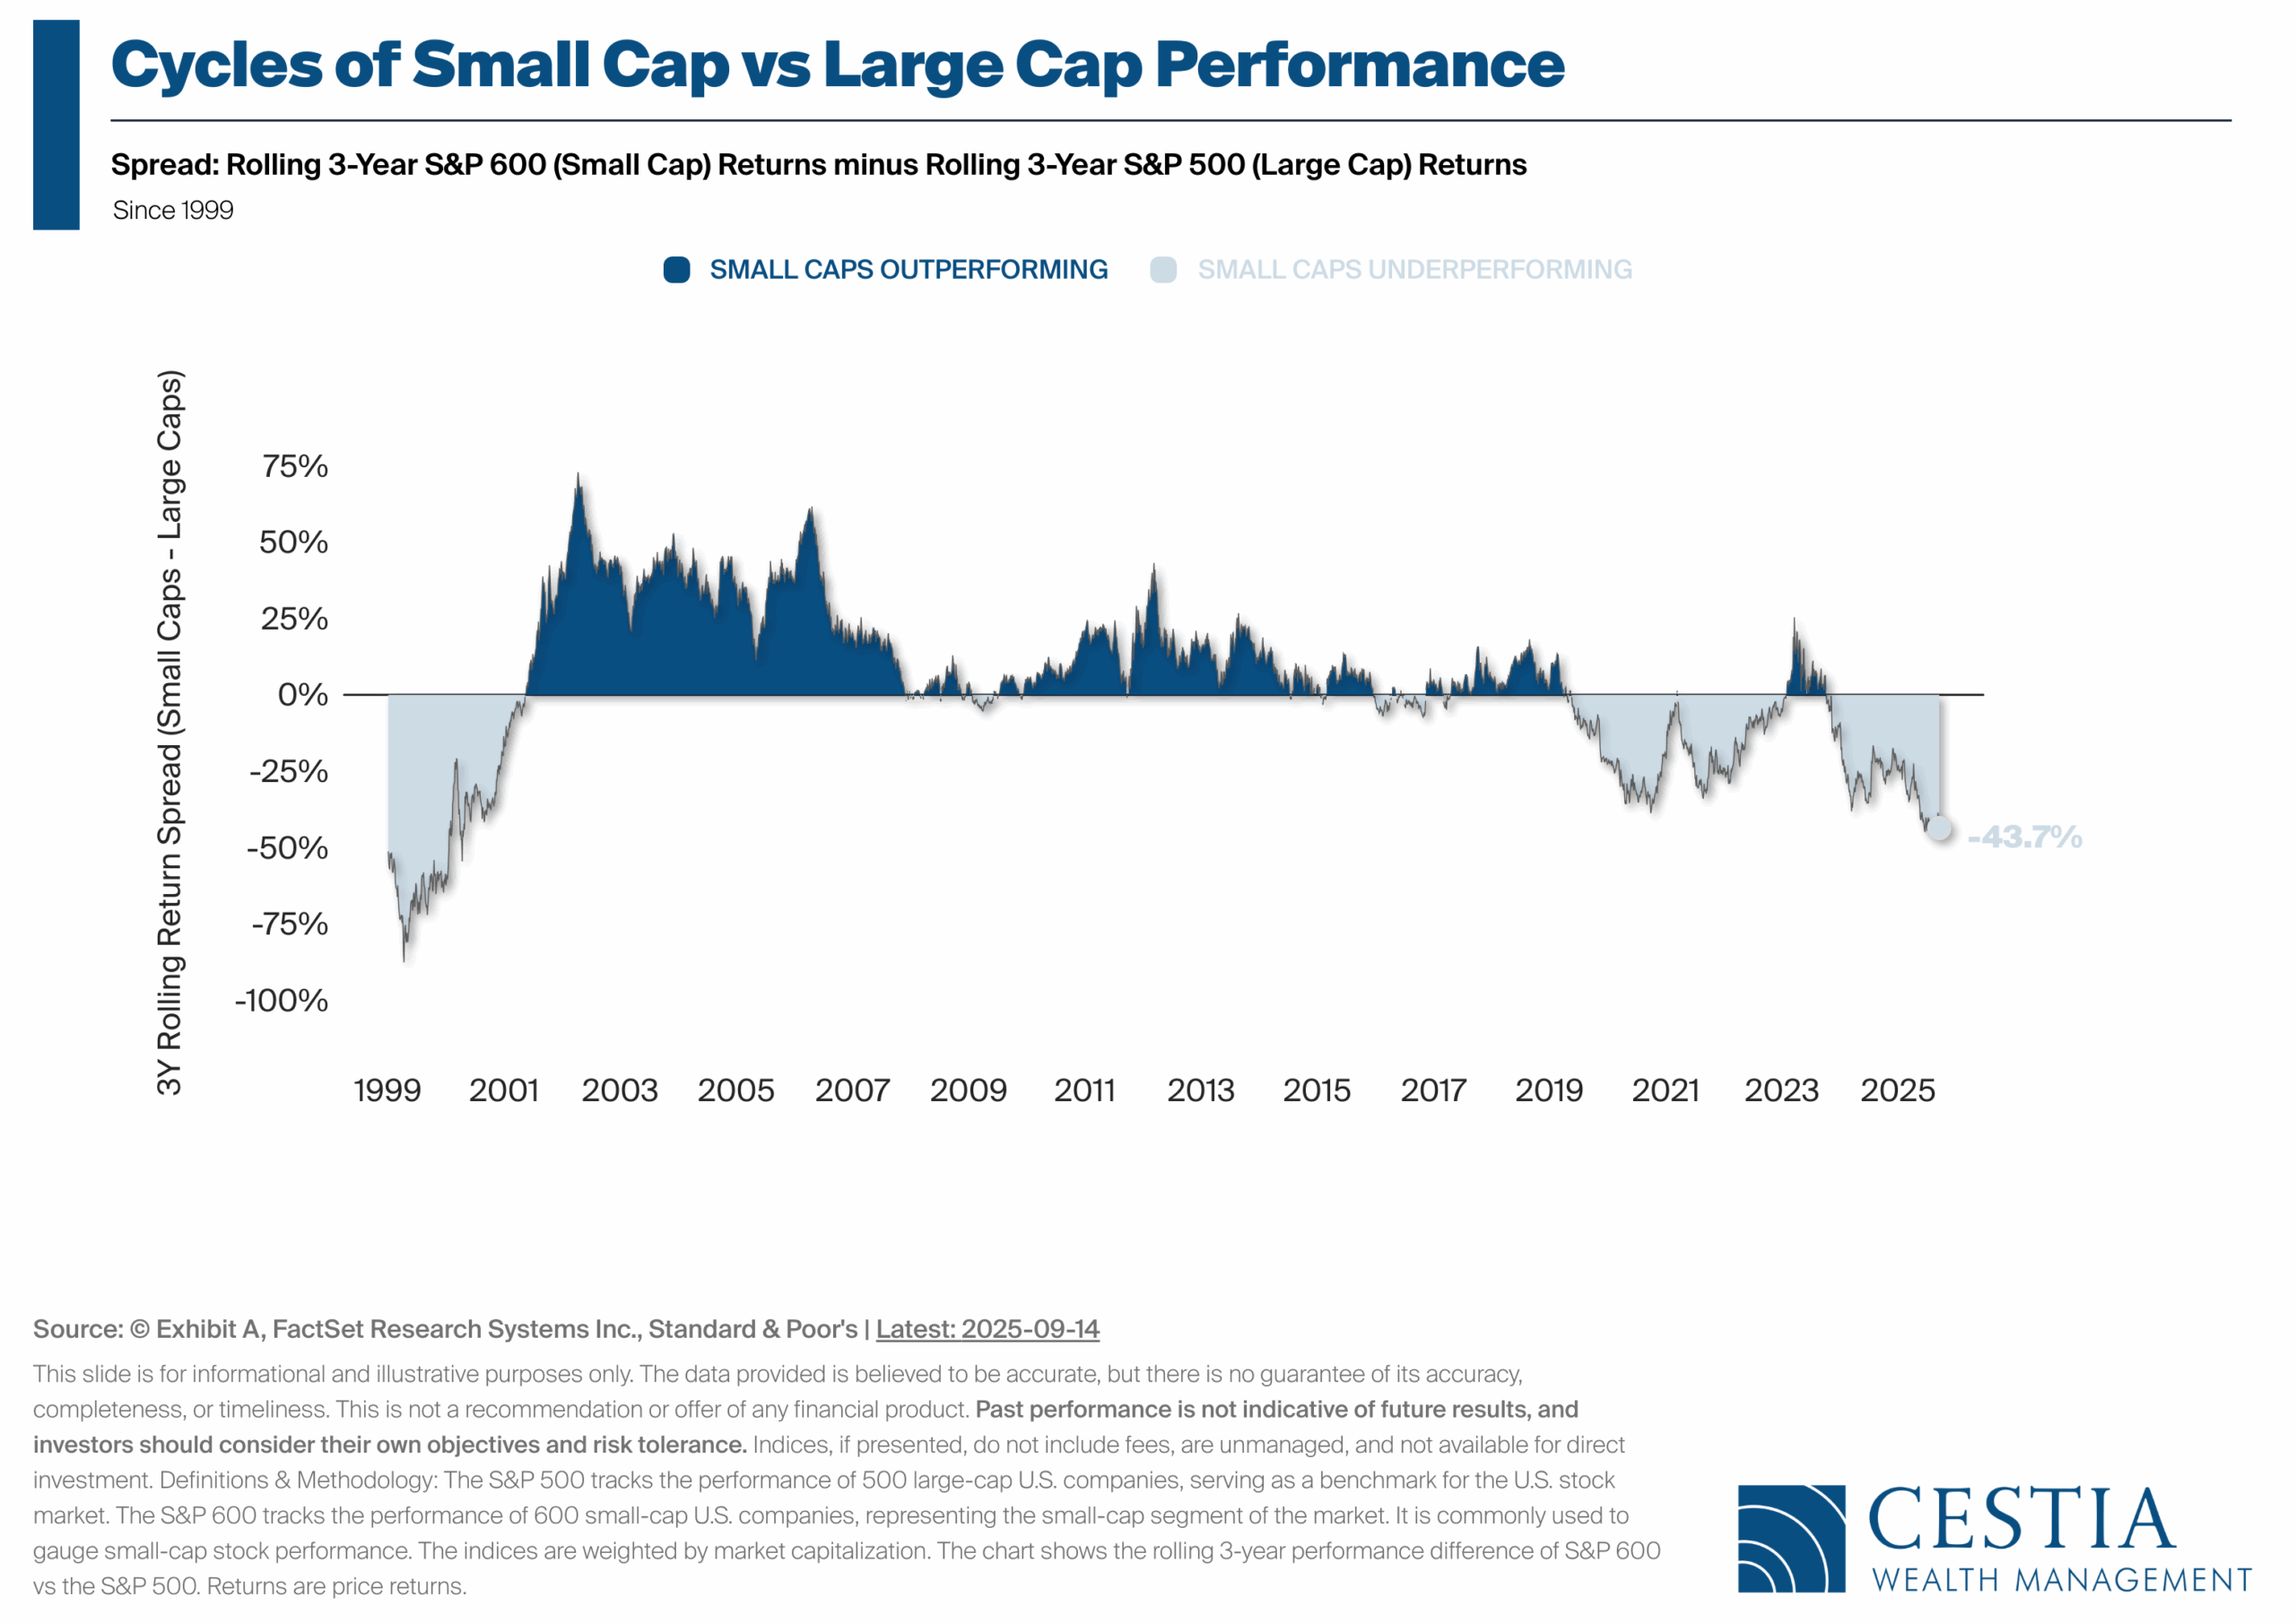
Market leadership doesn’t stay in one lane forever. Sometimes small companies lead the charge, other times the big names dominate. Understanding these shifts can help us put today’s numbers into perspective. Here are a few bullet points to consider:
-
Market Cycles at Work – Small-cap and large-cap stocks don’t move in lockstep. Over time, leadership has rotated back and forth, with each style enjoying periods of outperformance.
-
What the Numbers Say Today – As of September 14, 2025, small-cap stocks (S&P 600) are lagging large-cap stocks (S&P 500) by 43.7% over the past three years.
-
Why It Matters – This wide gap is notable but not unprecedented. History shows these cycles often turn, sometimes creating opportunities for the overlooked side of the market.
Portfolio Takeaway – Keeping both small and large caps in a portfolio helps investors benefit when leadership shifts. A disciplined, diversified approach can help smooth these cycles rather than trying to time them.

- Should you choose a CD or a Treasury?
-
Can a Fed Rate Cut Boost the Magnificent Seven to New Heights?

What Issues Should I Consider With My Social Security Retirement Benefits?
Social Security retirement benefits can be particularly complex, and clients really struggle with their decision on how to file.
With our guidance, clients can determine how to best approach their Social Security retirement benefits, and whether their benefits may tie in with other financial planning goals. Get a step ahead, and be prepared to provide thoughtful answers to your client’s many questions.
Our checklist covers the key issues to consider when a client must make a decision surrounding their Social Security retirement benefits, such as:
- Determining whether they should file early or delay their benefits.
- Understanding the claiming options they have at their disposal.
- Coordinating their benefits with the spouse or ex-spouse.
- Understanding how their benefits may impact other tax-planning goals.
Source: fp Pathfinder

Market Recap
Equities advanced last week as softer economic data fueled expectations of faster Fed rate cuts. Large-cap growth stocks led the way, with ten of eleven S&P 500 sectors higher—technology outperformed on AI enthusiasm, highlighted by Oracle’s surge following its $300B OpenAI deal. Overseas, developed and emerging markets gained, supported by strength in Japan and China.
Fixed Income
Bonds moved higher as long-term yields declined. The 10-year Treasury fell to 4.06% while the 2-year rose slightly, flattening the curve. Long-duration bonds, particularly high-yield, delivered strong returns as credit spreads tightened.
Economic Data
Labor market concerns deepened with a large downward jobs revision—nonfarm payrolls for the year ending March 2025 were reduced by 911,000, the biggest cut since 2000. Jobless claims rose, and inflation remained sticky: headline CPI up 0.4% in August, core CPI up 0.3%. Consumer sentiment weakened on inflation worries and tariff uncertainty.

(as of Monday’s Market Opening)
| Total Return (1D) | Total Return (1W) | Total Return (MTD) | Total Return (QTD) | Total Return (YTD) | |
| S&P 500 | 0.50% | 1.88% | 2.43% | 6.65% | 12.51% |
| Dow Jones Industrial Average | 0.09% | 0.79% | 0.72% | 4.04% | 7.83% |
| NASDAQ | 0.63% | 2.21% | 3.84% | 9.38% | 15.38% |
| NASDAQ 100 | 0.52% | 1.91% | 3.42% | 6.78% | 15.25% |
| Russell 1000 | 0.41% | 1.94% | 2.33% | 6.89% | 13.25% |
| Russell 2000 | 0.20% | 0.44% | 1.56% | 10.68% | 8.63% |
| Russell 3000 | 0.39% | 1.86% | 2.35% | 7.09% | 13.04% |
| ACWI | 0.45% | 2.15% | 2.64% | 6.50% | 17.46% |

When owners think about selling or transitioning their business, most jump straight to value and deal terms. But one of the most overlooked elements is personal readiness.
That’s where the Personal Readiness Scorecard comes in. It measures how prepared you are—personally and financially—for life after business. The scorecard looks at factors such as:
-
Do you have a written personal plan and clear goals outside the business?
-
Is there an integrated financial and estate plan in place?
-
Do you understand your post-business income needs?
-
How dependent are you on the business for your personal lifestyle?
-
Have you discussed transition goals with your family and advisory team?
Owners rate themselves in each category, producing a readiness percentage. A high score suggests you’re in control and prepared; a low score reveals gaps that could jeopardize both your financial security and your legacy.
Why it matters: Research shows that many owners regret their exit within 12 months—not because of money, but because they weren’t ready personally. By addressing these areas now, you protect not only your wealth, but your future happiness.
Tip: Even if you’re years away from a transition, walk through the scorecard. It will highlight where to start today so you can enjoy both a successful transaction and a fulfilling next chapter.
DOWNLOAD Our Personal Readiness Scorecard
SOURCE: The Exit Planning Institute
Global Client Survey
We’re inviting you to take part in a quick, anonymous client survey. Your feedback helps us fine-tune our process, elevate your experience, and ensure we’re delivering what matters most to you. This isn’t just about checking a box—it’s about shaping the future of how we serve you. Your voice helps guide our next steps. We’re listening. We’re learning. And we’re grateful for your trust.
Take Our Survey Now (click here)
Disclosures
- Wealth Mechanics™ is a registered trademark of Cestia Wealth Management. Unauthorized use of the trademark, including but not limited to commercial use, reproduction, or imitation without explicit written permission from Cestia Wealth Management, is strictly prohibited.
- Market commentary provided by NewEdge Advisors
- Charts concerning market data are provided by Exhibit A.
- Guides and other downloadable firm material respective to financial planning processes and data are provided and powered by fpPathfinder.
- Advisory services offered through NewEdge Advisors, LLC, a registered investment adviser. Securities offered through NewEdge Securities, LLC. Member FINRA/SIPC. NewEdge Advisors, LLC and NewEdge Securities, LLC are wholly owned subsidiaries of NewEdge Capital Group, LLC.
- Cestia Wealth Management is not a legal tax professional. We offer tax gap analysis for clients who desire to have a comprehensive financial plan, which requires in-depth tax strategy and planning as a distinct part of the overall customized solution. Please consult your tax professional on all matters addressed in this report.
- Information about annuities are not to be considered a recommendation. The information provided should not considered a recommendation to purchase or sell any particular security.
- Investing involves risk, including the potential loss of principal. No investment strategy can guarantee a profit or protect against loss in periods of declining values. Past performance is no guarantee of future results. Please note that individual situations can vary. Therefore, the information presented here should only be relied upon when coordinated with individual professional advice.
