



Week Ending April 24, 2026
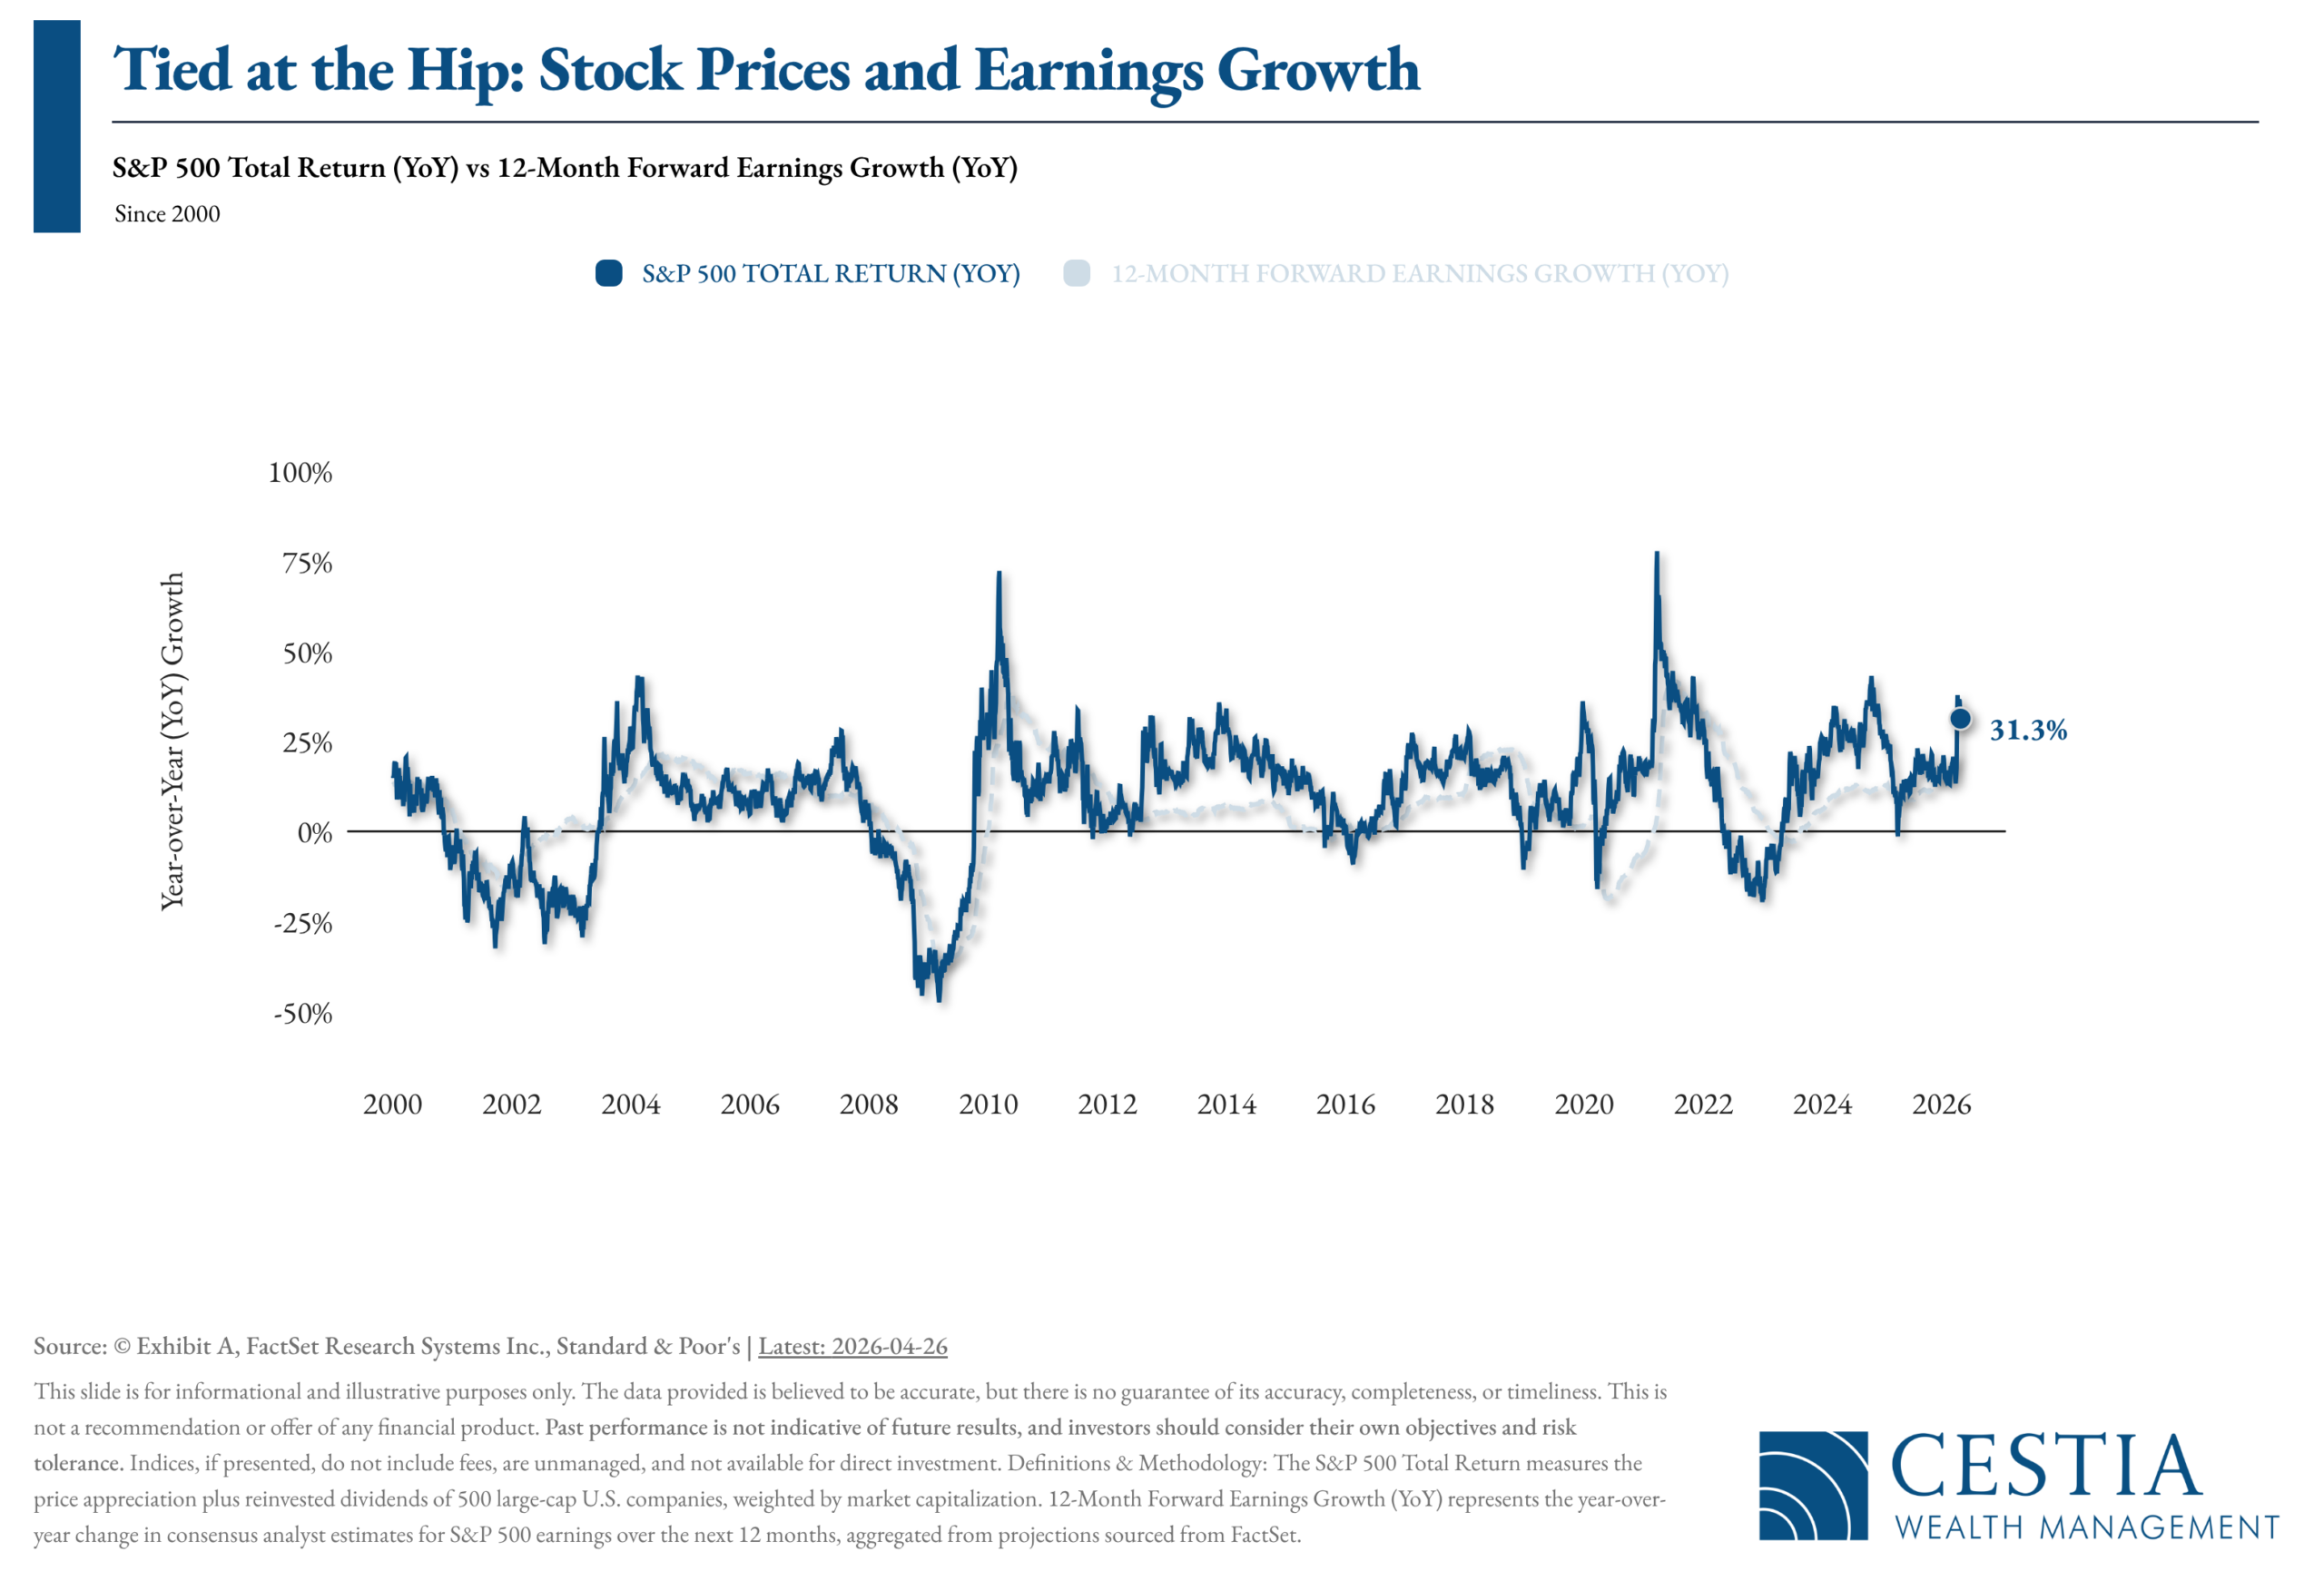
What Drives Stock Returns? Follow the Earnings.
Markets can be noisy — but the data tells a clear story. Since 2000, stock returns and earnings growth have moved largely in tandem, and the past year is no exception. The S&P 500 delivered a total return of 31.3%, while 12-month forward earnings estimates grew by 22.7%.
Short-term volatility will always be part of the picture, driven by sentiment and headlines. But over time, one thing consistently moves markets: earnings growth. It’s the engine, and the numbers continue to prove it.

Blowout Earnings Reports Give Wall Street Reason to Believe the Bull Case
Warsh says he made no rate-cut promises to Trump, plans ‘robust’ Fed reforms

5 Questions with Fidelity: Bond strategies for today’s market
Learn how different bond strategies may help support stability, income, tax efficiency, and more in the latest video from Fidelity. Click to watch.
Key Takeaways
- Many people assume bonds only stabilize the volatility of stocks. But bonds can also help with income generation, inflation-risk management, diversification, or tax considerations.
- When interest rates rise, bond prices generally fall. Some investors hedge against this “interest rate risk” by building a bond ladder, where you hold a succession of bonds until they mature. So, if rates rise, the bonds that are maturing can be reinvested at higher yields.
- The amount of bonds you hold depends on your goals, time frame, and comfort with risk. Investors with shorter time horizons may prioritize stability differently than those with longer time frames, who may have greater capacity to withstand market fluctuations.

Equities
- U.S. markets edged higher, with the S&P 500 and Nasdaq closing the week at record levels
- Q1 earnings season is off to a strong start — 84% of reporting S&P 500 companies beat EPS estimates, with blended earnings growth at 15.1%
- If that pace holds, it would mark six straight quarters of double-digit earnings growth
- Growth outpaced Value for the week; Energy and Tech led sectors, while Health Care and Financials lagged
- International results were mixed — Emerging Markets gained while developed foreign markets declined
Bonds
- Bond prices fell as yields rose across the curve; the 10-year Treasury ended the week at 4.31%, the 2-year at 3.78%
- The 2–10 year spread widened to 53 basis points
- The Bloomberg US Aggregate Index declined 0.26%; high-yield bonds slipped 0.19%
- Corporate bonds also pulled back, with short-term down 0.11% and long-term down 0.45%
Macroeconomic Data
- Retail sales surged 1.7% in March — the strongest reading since early 2023 — with underlying demand remaining solid ex-gas
- Jobless claims ticked up slightly but remain at historically healthy levels
- Manufacturing activity hit a near four-year high, with the S&P Global PMI rising to 54.0 in April
- Consumer sentiment softened to 49.8, while inflation expectations climbed — a reminder that uncertainty lingers beneath the resilient spending data

(as of Monday’s Market Opening)
| Total Return (1D) | Total Return (1W) | Total Return (MTD) | Total Return (QTD) | Total Return (YTD) | |
| S&P 500 | 0.11% | 0.90% | 9.87% | 9.87% | 4.79% |
| Dow Jones Industrial Average | -0.11% | -0.53% | 6.12% | 6.12% | 2.32% |
| NASDAQ | 0.13% | 1.90% | 15.18% | 15.18% | 7.00% |
| NASDAQ 100 | -0.19% | 2.49% | 14.79% | 14.79% | 7.93% |
| Russell 1000 | 0.12% | 0.68% | 9.71% | 9.71% | 5.00% |
| Russell 2000 | 0.17% | -0.08% | 11.74% | 11.74% | 12.78% |
| Russell 3000 | 0.10% | 0.57% | 9.71% | 9.71% | 5.33% |
| ACWI | 0.00% | -0.27% | 8.76% | 8.76% | 6.36% |
Global Client Survey
We’re inviting you to take part in a quick, anonymous client survey. Your feedback helps us fine-tune our process, elevate your experience, and ensure we’re delivering what matters most to you. This isn’t just about checking a box—it’s about shaping the future of how we serve you. Your voice helps guide our next steps. We’re listening. We’re learning. And we’re grateful for your trust.
Take Our Survey Now (click here)
Disclosures
- Wealth Mechanics™ is a registered trademark of Cestia Wealth Management. Unauthorized use of the trademark, including but not limited to commercial use, reproduction, or imitation without explicit written permission from Cestia Wealth Management, is strictly prohibited.
- Market commentary provided by NewEdge Advisors
- Charts concerning market data are provided by Exhibit A.
- Guides and other downloadable firm material respective to financial planning processes and data are provided and powered by fpPathfinder.
- Advisory services offered through NewEdge Advisors, LLC, a registered investment adviser. Securities offered through NewEdge Securities, LLC. Member FINRA/SIPC. NewEdge Advisors, LLC and NewEdge Securities, LLC are wholly owned subsidiaries of NewEdge Capital Group, LLC.
- Cestia Wealth Management is not a legal tax professional. We offer tax gap analysis for clients who desire to have a comprehensive financial plan, which requires in-depth tax strategy and planning as a distinct part of the overall customized solution. Please consult your tax professional on all matters addressed in this report.
- Information about annuities are not to be considered a recommendation. The information provided should not considered a recommendation to purchase or sell any particular security.
- Investing involves risk, including the potential loss of principal. No investment strategy can guarantee a profit or protect against loss in periods of declining values. Past performance is no guarantee of future results. Please note that individual situations can vary. Therefore, the information presented here should only be relied upon when coordinated with individual professional advice.
