



Week Ending January 30, 2026
WEEKLY TOUCHPOINT
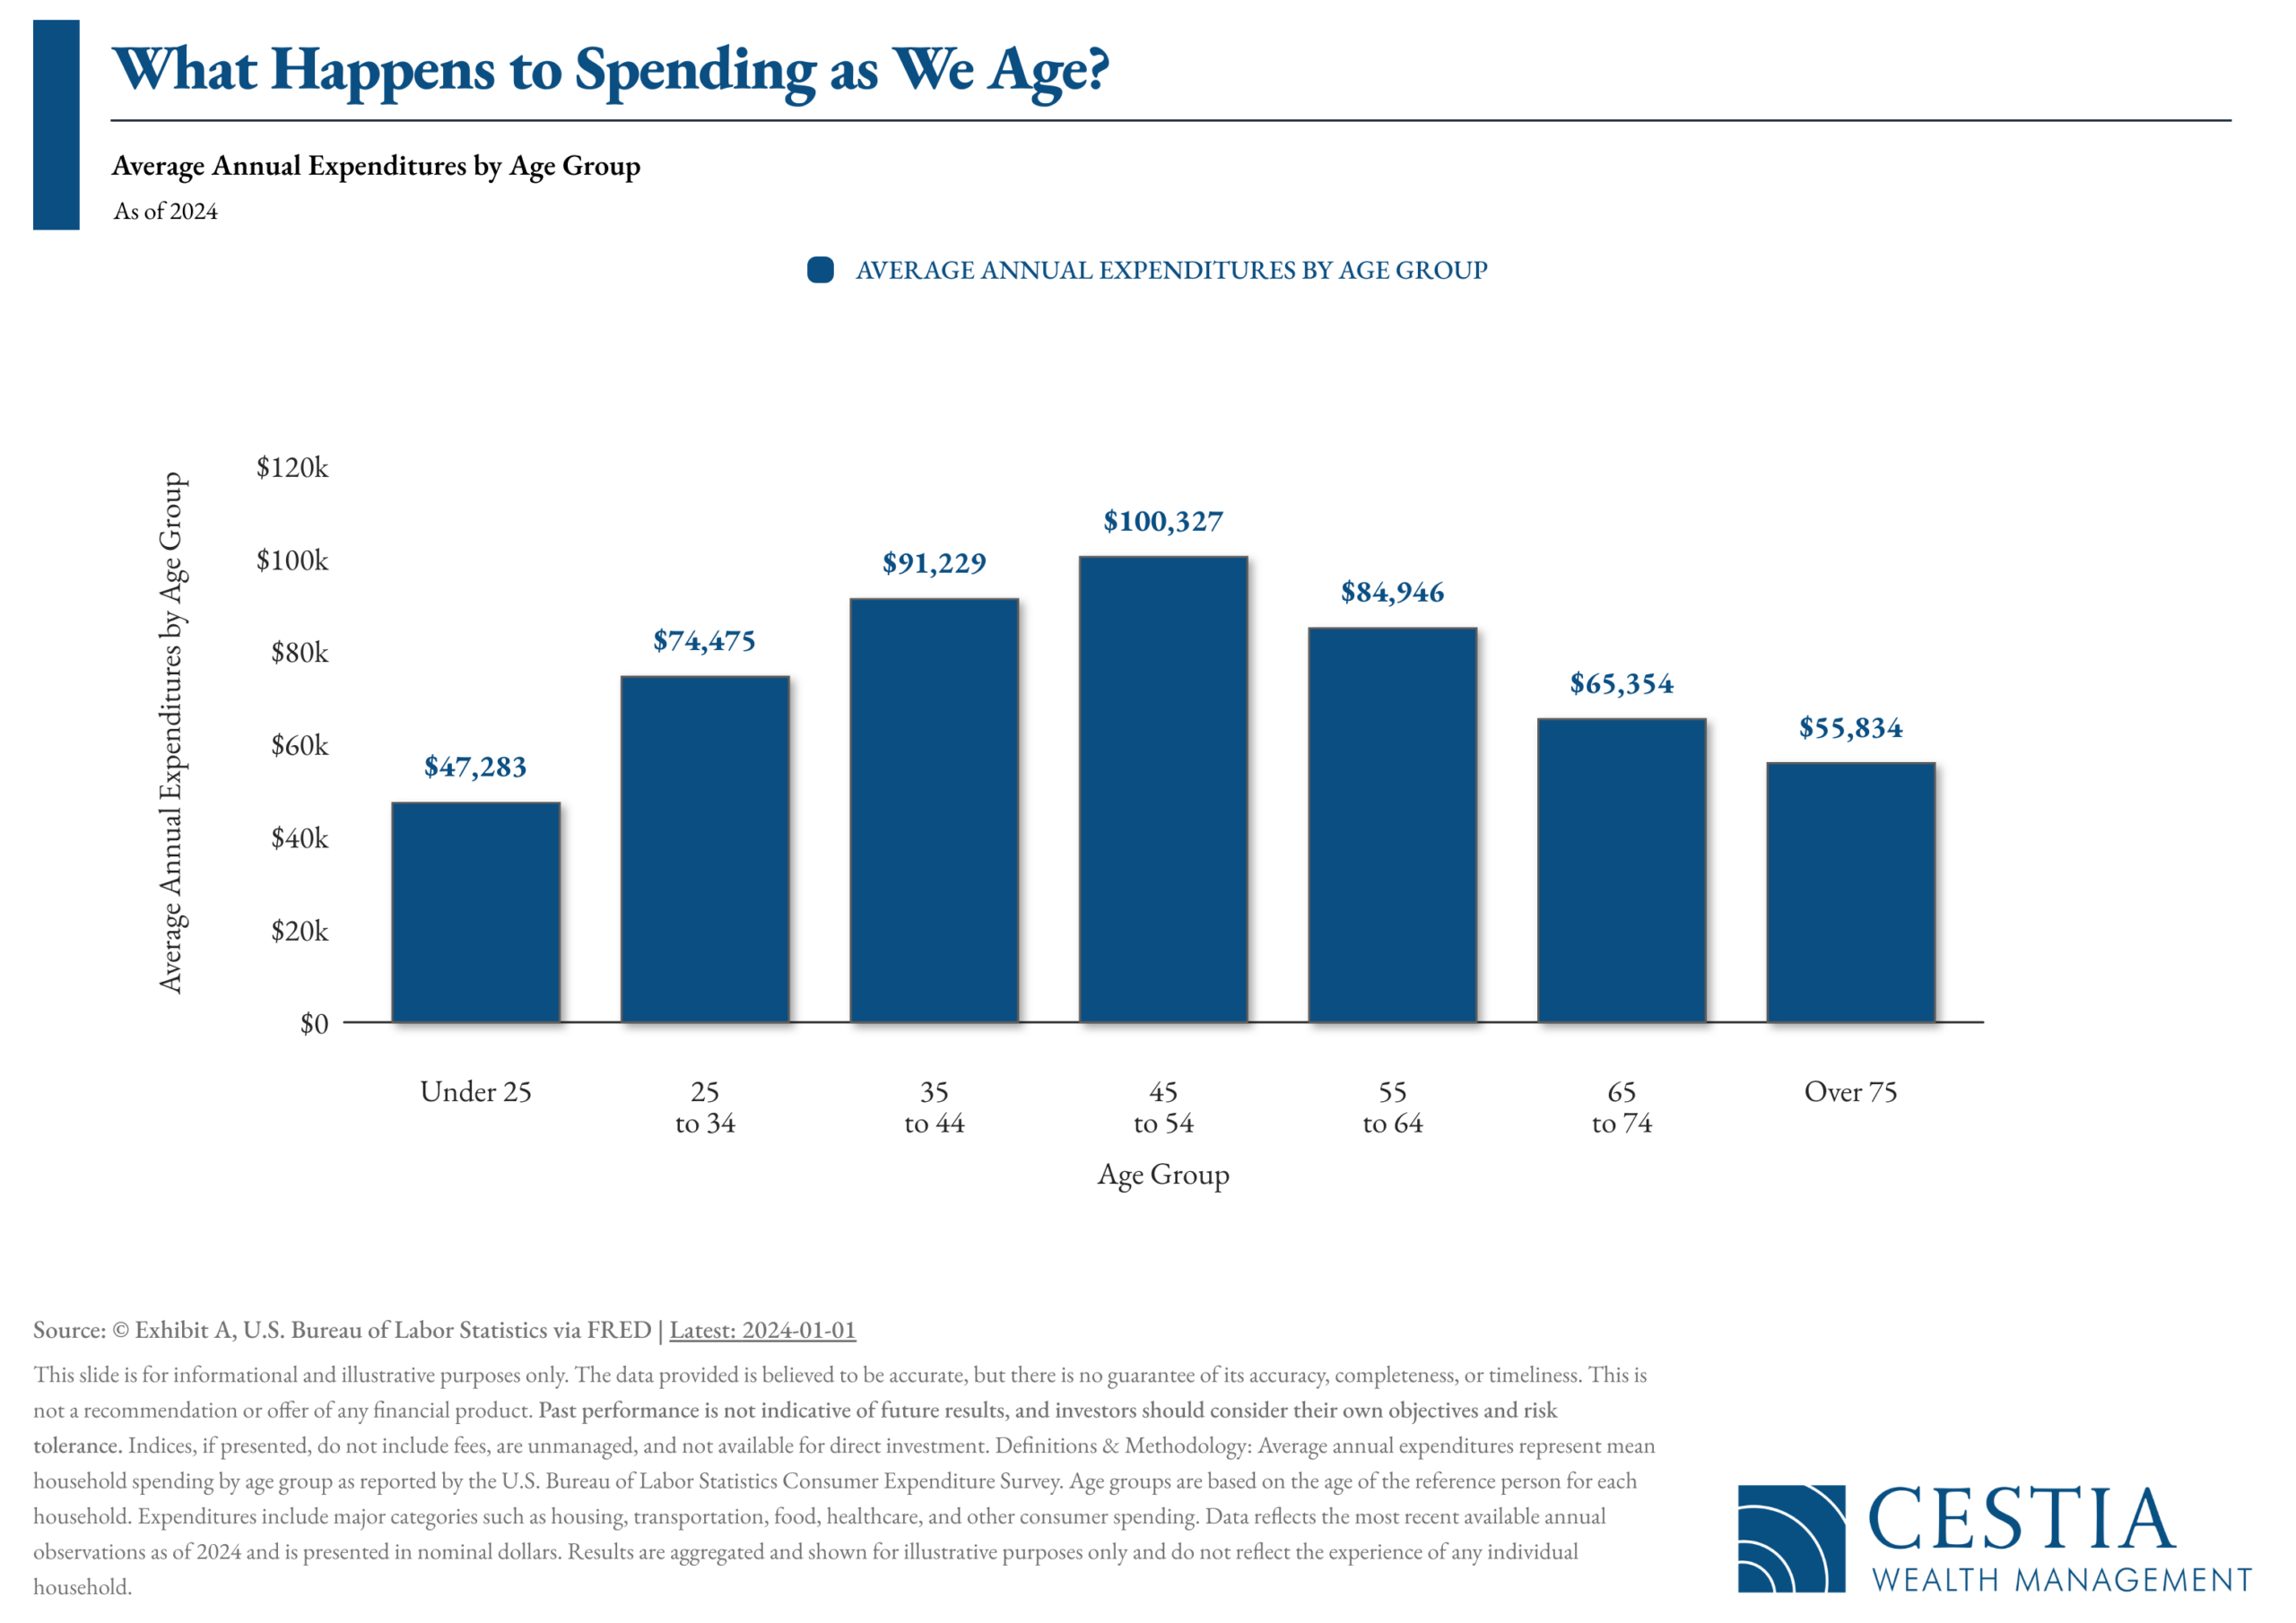
How Spending Changes Across Life Stages — and Why It Matters
- Spending isn’t linear—it follows life. Household spending tends to rise steadily from early adulthood as careers advance, families grow, and responsibilities expand.
- Peak earning years often mean peak spending. The data shows spending topping out in the late-40s to early-50s—just north of $100,000 annually—when households are often juggling mortgages, college costs, healthcare, and lifestyle commitments.
- A natural slowdown follows. As people move past their prime working years, average spending gradually declines, with households age 75+ spending meaningfully less than their mid-career counterparts.
- Retirement doesn’t require identical income. This pattern reinforces an important planning insight: retirement income needs are often lower than pre-retirement earnings, especially once major obligations fade.
- Flexibility is the real goal. Rather than planning for a single, fixed number, long-term strategies work best when they adapt—shifting from accumulation during high-spend years to efficiency and sustainability later on.
Bottom line: A thoughtful financial plan recognizes that life evolves. By aligning savings, investment strategy, and income planning with how spending naturally changes over time, clients can feel more confident navigating each chapter—without over- or under-planning for the future.

Can Big Tech Earnings Soothe Investors’ AI Bubble Worries?
Trump Bolsters Critical Minerals Pipeline with $1.6 Billion Stake in USA Rare Earth
Beyond Basic Inflation Calculators: What Your Money Actually Bought (1970 – Today)
Who Is On the Other Side? (A Framework for Understanding Market (In)Efficiency)
Market Monitor by Goldman Sachs
Is the Market Underpricing the Risk of Fed Hikes?
SpaceX seeks federal approval to launch 1 million solar-powered satellite data centers
The income squeeze: How market concentration is reshaping equity returns

Navigating High Inflation: What Really Matters for Your Plan
Inflation has a way of sneaking into everyday life—at the grocery store, the gas pump, and even in long-term planning assumptions. While no one can control inflation, how we respond to it can make a meaningful difference.
Here are a few key areas we’re paying close attention to—and that clients should keep in mind during periods of elevated inflation:
- Cash flow comes first. Inflation often shows up as higher monthly expenses before anything else. Reviewing spending patterns, identifying pressure points, and adjusting expectations can help keep day-to-day cash flow aligned with long-term goals.
- Not all assets react the same way. Some investments struggle in inflationary environments, while others may help offset rising prices. Portfolio construction matters here—diversification and intentional positioning become especially important.
- Taxes matter more when dollars stretch less. Inflation can quietly push income into higher tax brackets or reduce the real value of deductions and credits. Thoughtful tax planning—timing income, deductions, and strategic contributions—can help preserve purchasing power.
- Debt and inflation interact in nuanced ways. Fixed-rate debt may become less burdensome in real terms, while variable-rate obligations can become more expensive. Understanding where debt helps—or hurts—the plan is essential.
- Expectations deserve a reset. High inflation often requires revisiting assumptions around savings rates, retirement income needs, and lifestyle flexibility. Planning isn’t about perfection—it’s about adaptability.
The takeaway: Inflation doesn’t require reactive decisions, but it does call for awareness and intention. A well-engineered financial plan anticipates changing conditions and remains flexible enough to adjust—without losing sight of what truly matters over time.
SOURCE: fpPathfinder

Equities
- U.S. stocks had a mixed week, even as the S&P 500 briefly peeked above 7,000 intraday—proof that headlines and portfolios don’t always move in lockstep.
- Precious metals stole the drama late in the week: gold fell more than 10% and silver over 30% after President Trump nominated Kevin Warsh to lead the Federal Reserve, signaling a more inflation-hawkish stance.
- Near-term earnings optimism improved as Q4 2025 growth expectations jumped from 8.2% to 11.9%, with roughly one-third of companies now reporting.
- Looking further out, analysts trimmed 2026 earnings growth to 14.3%, a reminder that markets constantly reprice the future—not just the present.
- Large-caps outpaced small and mid-caps, value beat growth, and international stocks quietly outperformed U.S. markets—reinforcing the case for diversification over prediction.
Bonds
- Fixed income was mixed, with yields telling a nuanced story rather than a simple “rates up or down” narrative.
- The 2-year Treasury yield dropped to 3.52%, while the 10-year held steady at 4.24%, steepening the yield curve to 0.72%.
- Short-duration investment-grade corporate bonds were the week’s bright spot, while long-duration government bonds lagged.
- Investment-grade corporate yields ended at 4.85%, and high-yield bonds closed around 7.05%, keeping income opportunities firmly on the table.
- The Fed held rates steady at 3.50%–3.75% after three prior cuts—though two dissenting votes in favor of a cut hint that policy debates are far from settled.
Macroeconomic Data
- Economic data took a back seat to Washington, as markets focused on the potential transition from Chair Jerome Powell to Warsh when Powell’s term ends in May.
- Initial jobless claims rose modestly to 209,000, while continuing claims fell to 1.83 million—still well below last summer’s highs.
- Inflation pressures resurfaced at the producer level, with headline PPI up 0.5% and core PPI rising 0.7%, the strongest gain since July.
- Consumer sentiment weakened sharply: the Conference Board Consumer Confidence Index dropped to 84.5, its lowest reading since 2014.
- The Expectations Index slipped below levels that historically signal recession risk—highlighting the growing gap between economic anxiety and actual data.

(as of Monday’s Market Opening)
| Total Return (1D) | Total Return (1W) | Total Return (MTD) | Total Return (QTD) | Total Return (YTD) | |
| S&P 500 | -0.11% | -0.27% | -0.11% | 1.25% | 1.25% |
| Dow Jones Industrial Average | -0.15% | -1.20% | -0.15% | 1.57% | 1.57% |
| NASDAQ | -0.33% | -0.92% | -0.33% | 0.61% | 0.61% |
| NASDAQ 100 | -0.08% | -0.70% | -0.08% | 1.12% | 1.12% |
| Russell 1000 | -0.20% | -0.10% | 1.15% | 1.15% | 1.15% |
| Russell 2000 | -0.21% | -2.15% | 5.26% | 5.26% | 5.26% |
| Russell 3000 | -0.17% | -0.18% | 1.33% | 1.33% | 1.33% |
| ACWI | -0.15% | 0.08% | 2.68% | 2.68% | 2.68% |
Global Client Survey
We’re inviting you to take part in a quick, anonymous client survey. Your feedback helps us fine-tune our process, elevate your experience, and ensure we’re delivering what matters most to you. This isn’t just about checking a box—it’s about shaping the future of how we serve you. Your voice helps guide our next steps. We’re listening. We’re learning. And we’re grateful for your trust.
Take Our Survey Now (click here)
Disclosures
- Wealth Mechanics™ is a registered trademark of Cestia Wealth Management. Unauthorized use of the trademark, including but not limited to commercial use, reproduction, or imitation without explicit written permission from Cestia Wealth Management, is strictly prohibited.
- Market commentary provided by NewEdge Advisors
- Charts concerning market data are provided by Exhibit A.
- Guides and other downloadable firm material respective to financial planning processes and data are provided and powered by fpPathfinder.
- Advisory services offered through NewEdge Advisors, LLC, a registered investment adviser. Securities offered through NewEdge Securities, LLC. Member FINRA/SIPC. NewEdge Advisors, LLC and NewEdge Securities, LLC are wholly owned subsidiaries of NewEdge Capital Group, LLC.
- Cestia Wealth Management is not a legal tax professional. We offer tax gap analysis for clients who desire to have a comprehensive financial plan, which requires in-depth tax strategy and planning as a distinct part of the overall customized solution. Please consult your tax professional on all matters addressed in this report.
- Information about annuities are not to be considered a recommendation. The information provided should not considered a recommendation to purchase or sell any particular security.
- Investing involves risk, including the potential loss of principal. No investment strategy can guarantee a profit or protect against loss in periods of declining values. Past performance is no guarantee of future results. Please note that individual situations can vary. Therefore, the information presented here should only be relied upon when coordinated with individual professional advice.
