



Week Ending July 3, 2026
Small Caps Take the Lead in a Historic Reversal
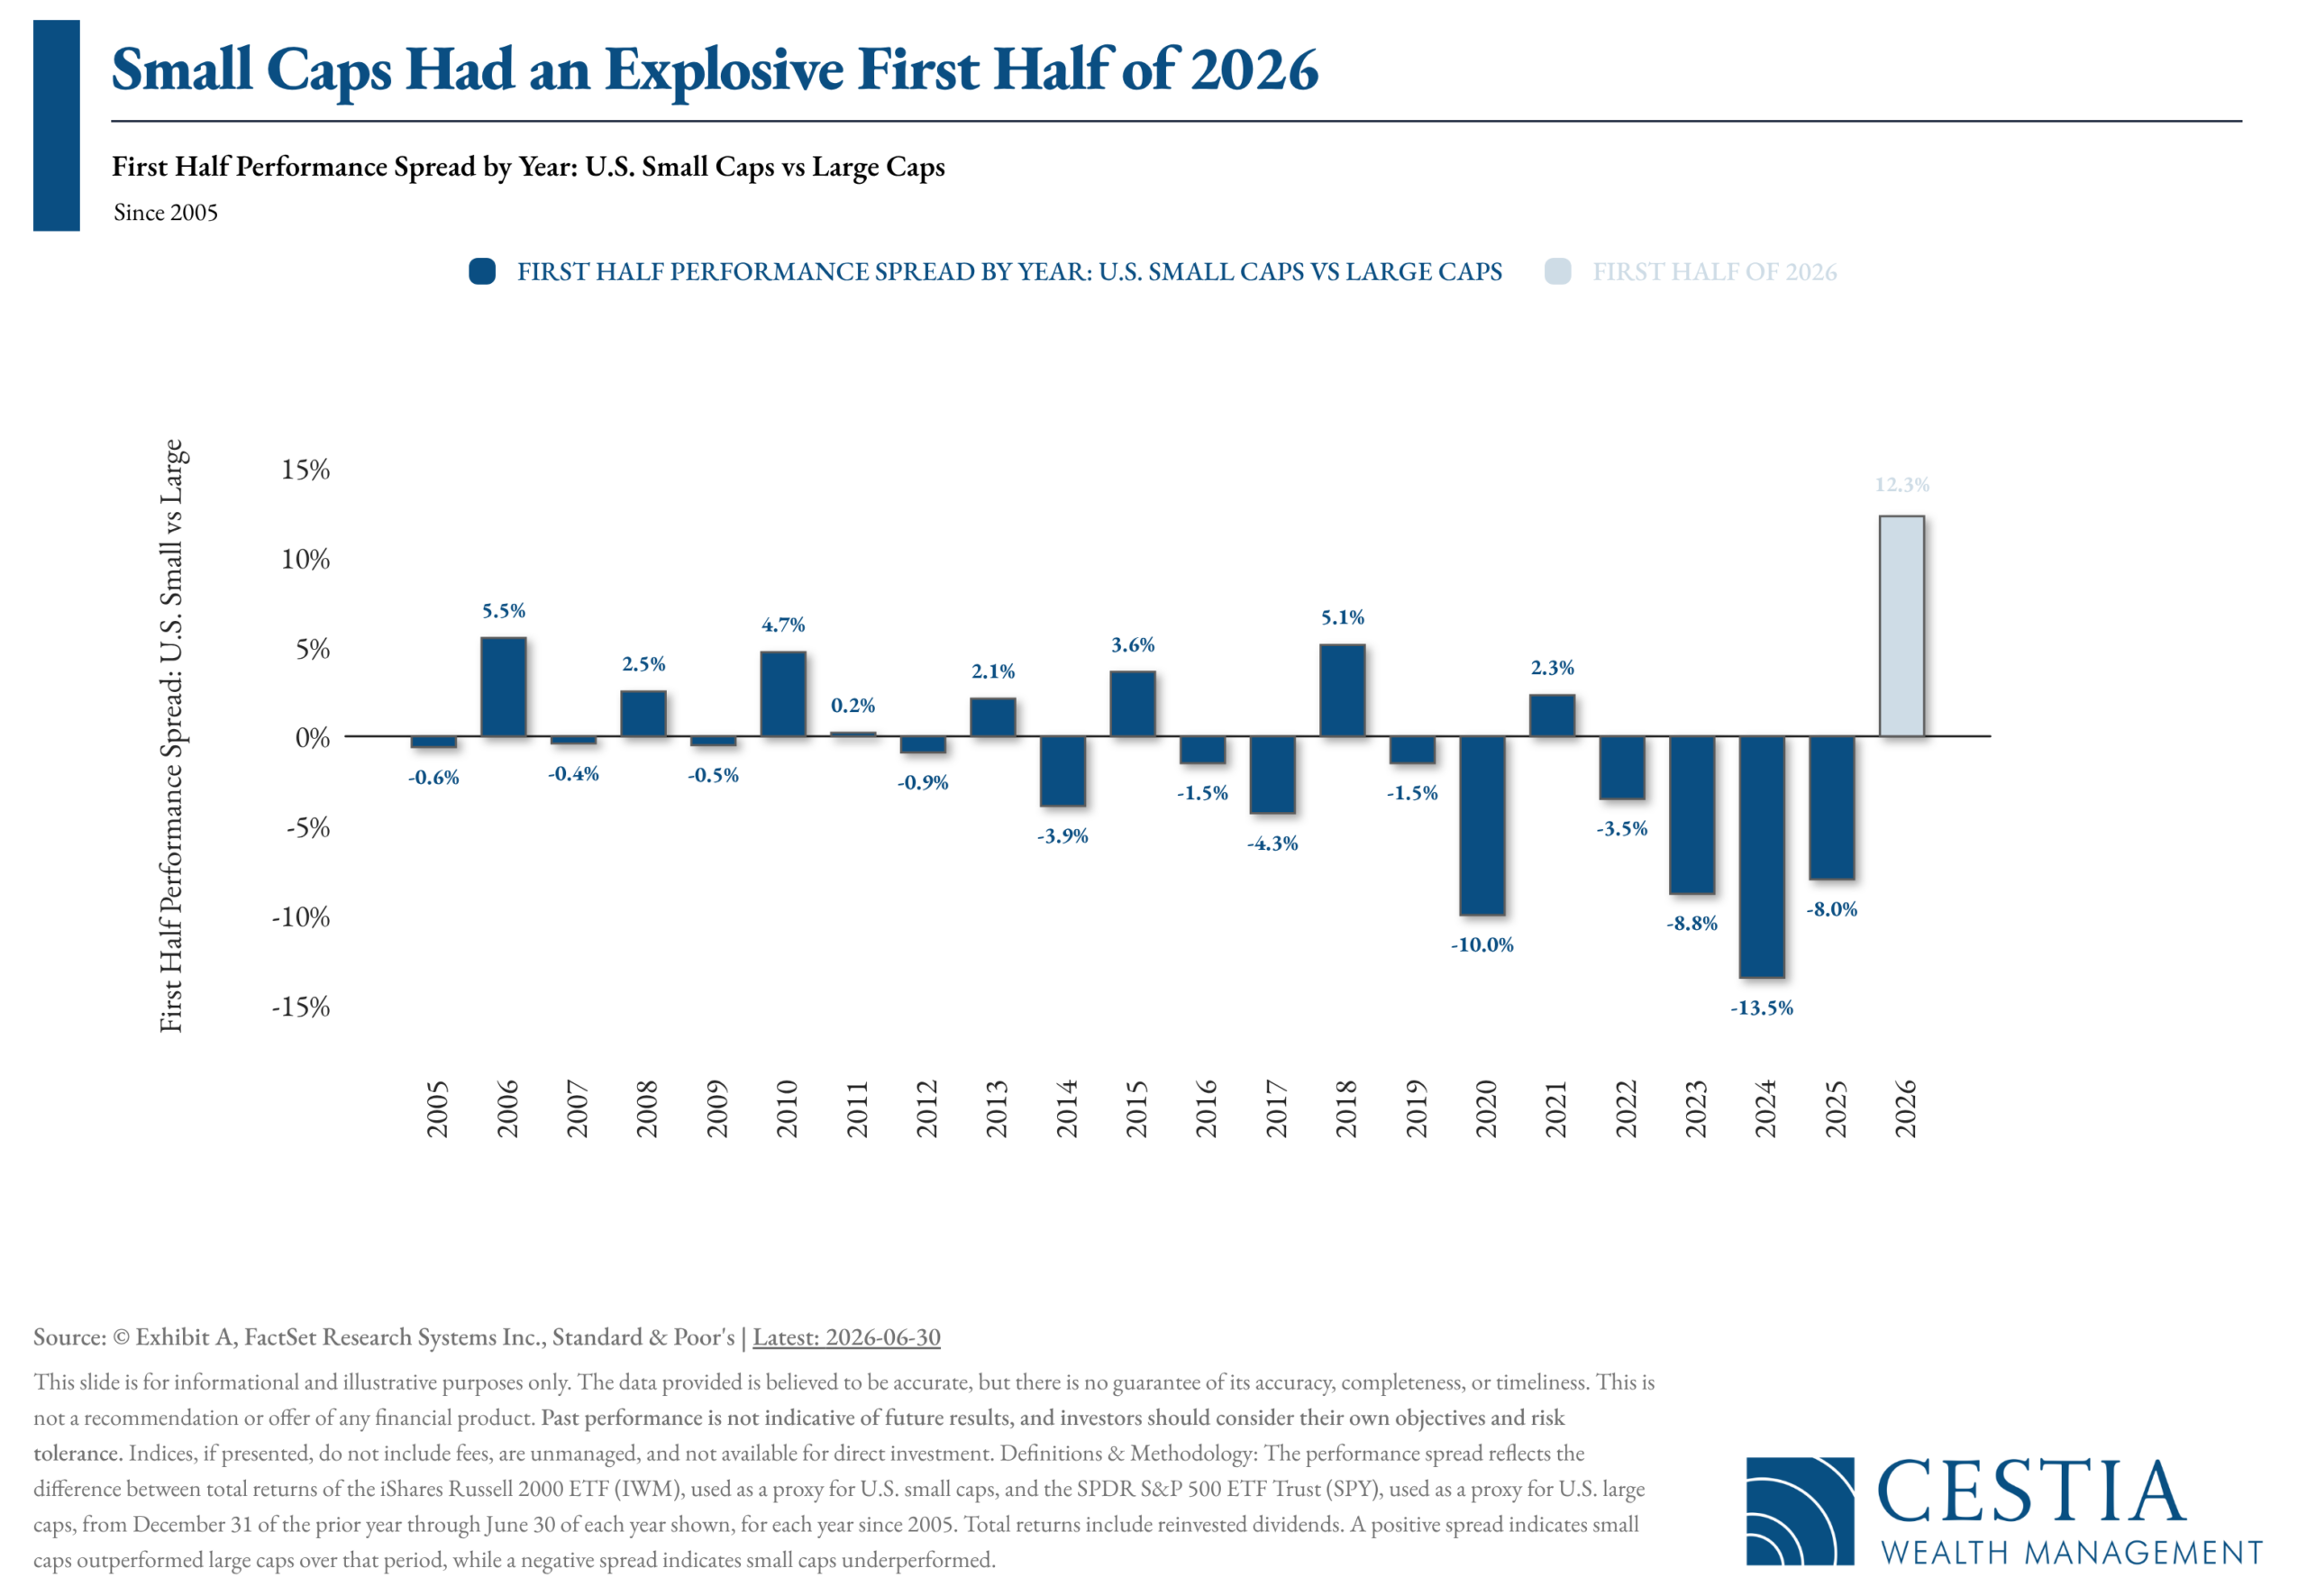
Each year, we track the first-half performance spread between U.S. small-cap and large-cap stocks, a comparison that has spanned market cycles since 2005. Over that period, small caps have lagged their large-cap counterparts in 14 of the past 21 first halves, with particularly steep underperformance in 2020 (-10.0%) and again in 2024 (-13.5%). This year broke sharply from that pattern: through the first half of 2026, small caps outperformed large caps by 12.3%, one of the most decisive reversals in the dataset’s history.
A shift of this magnitude, following years of small-cap underperformance, may point to a broader change in market leadership. That said, a single strong half does not confirm a durable trend, and history has shown that leadership rotations can be short-lived. For investors, the takeaway is less about predicting the next rotation and more about being positioned for it: those maintaining diversified exposure across market capitalizations are better equipped to benefit from shifts like this one, without needing to time them precisely.


What Issues Should I Consider When Reviewing Cash Flow?
Sound cash flow planning is the foundation on which every effective financial plan is built. Most clients understand, at least in principle, the importance of tracking and managing their spending. Yet even well-intentioned individuals often struggle to take the basic steps required to turn that understanding into practice. A clear view of where money comes from and where it goes creates the discipline and accountability that support every other planning decision that follows.
A thoughtful review of cash flow considers several core areas: income sources, essential versus discretionary spending, outstanding debt and tax obligations, funding for near- and long-term goals, and the ongoing monitoring needed to keep a plan on track. Addressing these areas with intention, rather than assumption, gives clients a stronger foundation for the decisions ahead and can have a meaningful, lasting impact on their long-term financial well-being.

Equities
- U.S. large-cap stocks advanced 1.8% during the holiday-shortened week, as a softer June employment report eased concerns over near-term Fed rate hikes
- Growth outpaced value, and larger companies outperformed their small- and mid-cap peers
- Communication services (+5.0%) and financials (+3.7%) led sector performance, while real estate, utilities, and energy declined
- Developed international markets rose 2.8%, outperforming U.S. large caps, while emerging markets gained 1.0%
- Oil settled near $69 per barrel as U.S.-Iran peace efforts continued, even as Strait of Hormuz shipping activity remained below prewar levels
Bonds
- Bonds declined as Treasury yields rose over the week, despite a brief pullback following the weaker employment report
- The 10-year Treasury yield rose to 4.49%, while the 2-year yield increased seven basis points to 4.14%, steepening the 2–10 year curve to 0.35%
- Longer-duration bonds saw the sharpest losses, with long-term government bonds down 1.6% and long-term investment-grade corporates down 1.1%
- High-yield bonds bucked the trend, advancing across the maturity spectrum, including a 1.2% gain among longer-duration issues, as improving risk sentiment and tighter credit spreads offset rising Treasury yields
Macroeconomic Data
- June nonfarm payrolls rose by just 57,000 while the unemployment rate declined to 4.2%, pointing to a labor market that is cooling but still resilient
- April and May payroll gains were revised down by a combined 74,000; average hourly earnings rose 0.3% for the month and 3.5% year over year
- JOLTS data showed job openings holding steady at 7.6 million in May, with hires unchanged at 5.2 million
- Initial unemployment claims edged down to 215,000
- The ISM Manufacturing PMI eased to 53.3 from 54.0, marking a sixth consecutive month of expansion, with new orders holding strong and input-price pressures moderating
- Consumer confidence ticked up to 91.2 in June, while May construction spending rose 0.1% but remained 1.5% below year-earlier levels

(as of Monday’s Market Opening)
| Total Return
(1D) |
Total Return
(1W) |
Total Return (
MTD) |
Total Return
(QTD) |
Total Return (
YTD) |
|
| S&P 500 | 0.00% | 0.58% | -0.21% | -0.21% | 9.32% |
| Dow Jones Industrial Average | 1.14% | 1.37% | 1.11% | 1.11% | 10.06% |
| NASDAQ | -0.80% | 0.05% | -1.45% | -1.45% | 11.15% |
| NASDAQ 100 | -1.61% | -1.50% | -3.13% | -3.13% | 16.16% |
| Russell 1000 | -0.03% | 1.83% | -0.18% | -0.18% | 9.94% |
| Russell 2000 | -0.58% | -0.44% | -0.96% | -0.96% | 21.39% |
| Russell 3000 | -0.08% | 1.70% | -0.27% | -0.27% | 10.40% |
| ACWI | 0.02% | 0.94% | -0.52% | -0.52% | 11.08% |
Global Client Survey
We’re inviting you to take part in a quick, anonymous client survey. Your feedback helps us fine-tune our process, elevate your experience, and ensure we’re delivering what matters most to you. This isn’t just about checking a box—it’s about shaping the future of how we serve you. Your voice helps guide our next steps. We’re listening. We’re learning. And we’re grateful for your trust.
Take Our Survey Now (click here)
Disclosures
- Wealth Mechanics™ is a registered trademark of Cestia Wealth Management. Unauthorized use of the trademark, including but not limited to commercial use, reproduction, or imitation without explicit written permission from Cestia Wealth Management, is strictly prohibited.
- Market commentary provided by NewEdge Advisors
- Charts concerning market data are provided by Exhibit A.
- Guides and other downloadable firm material respective to financial planning processes and data are provided and powered by fpPathfinder.
- Advisory services offered through NewEdge Advisors, LLC, a registered investment adviser. Securities offered through NewEdge Securities, LLC. Member FINRA/SIPC. NewEdge Advisors, LLC and NewEdge Securities, LLC are wholly owned subsidiaries of NewEdge Capital Group, LLC.
- Cestia Wealth Management is not a legal tax professional. We offer tax gap analysis for clients who desire to have a comprehensive financial plan, which requires in-depth tax strategy and planning as a distinct part of the overall customized solution. Please consult your tax professional on all matters addressed in this report.
- Information about annuities are not to be considered a recommendation. The information provided should not considered a recommendation to purchase or sell any particular security.
- Investing involves risk, including the potential loss of principal. No investment strategy can guarantee a profit or protect against loss in periods of declining values. Past performance is no guarantee of future results. Please note that individual situations can vary. Therefore, the information presented here should only be relied upon when coordinated with individual professional advice.
