



Week Ending July 31, 2026
Measuring the 52-Week Drawdown
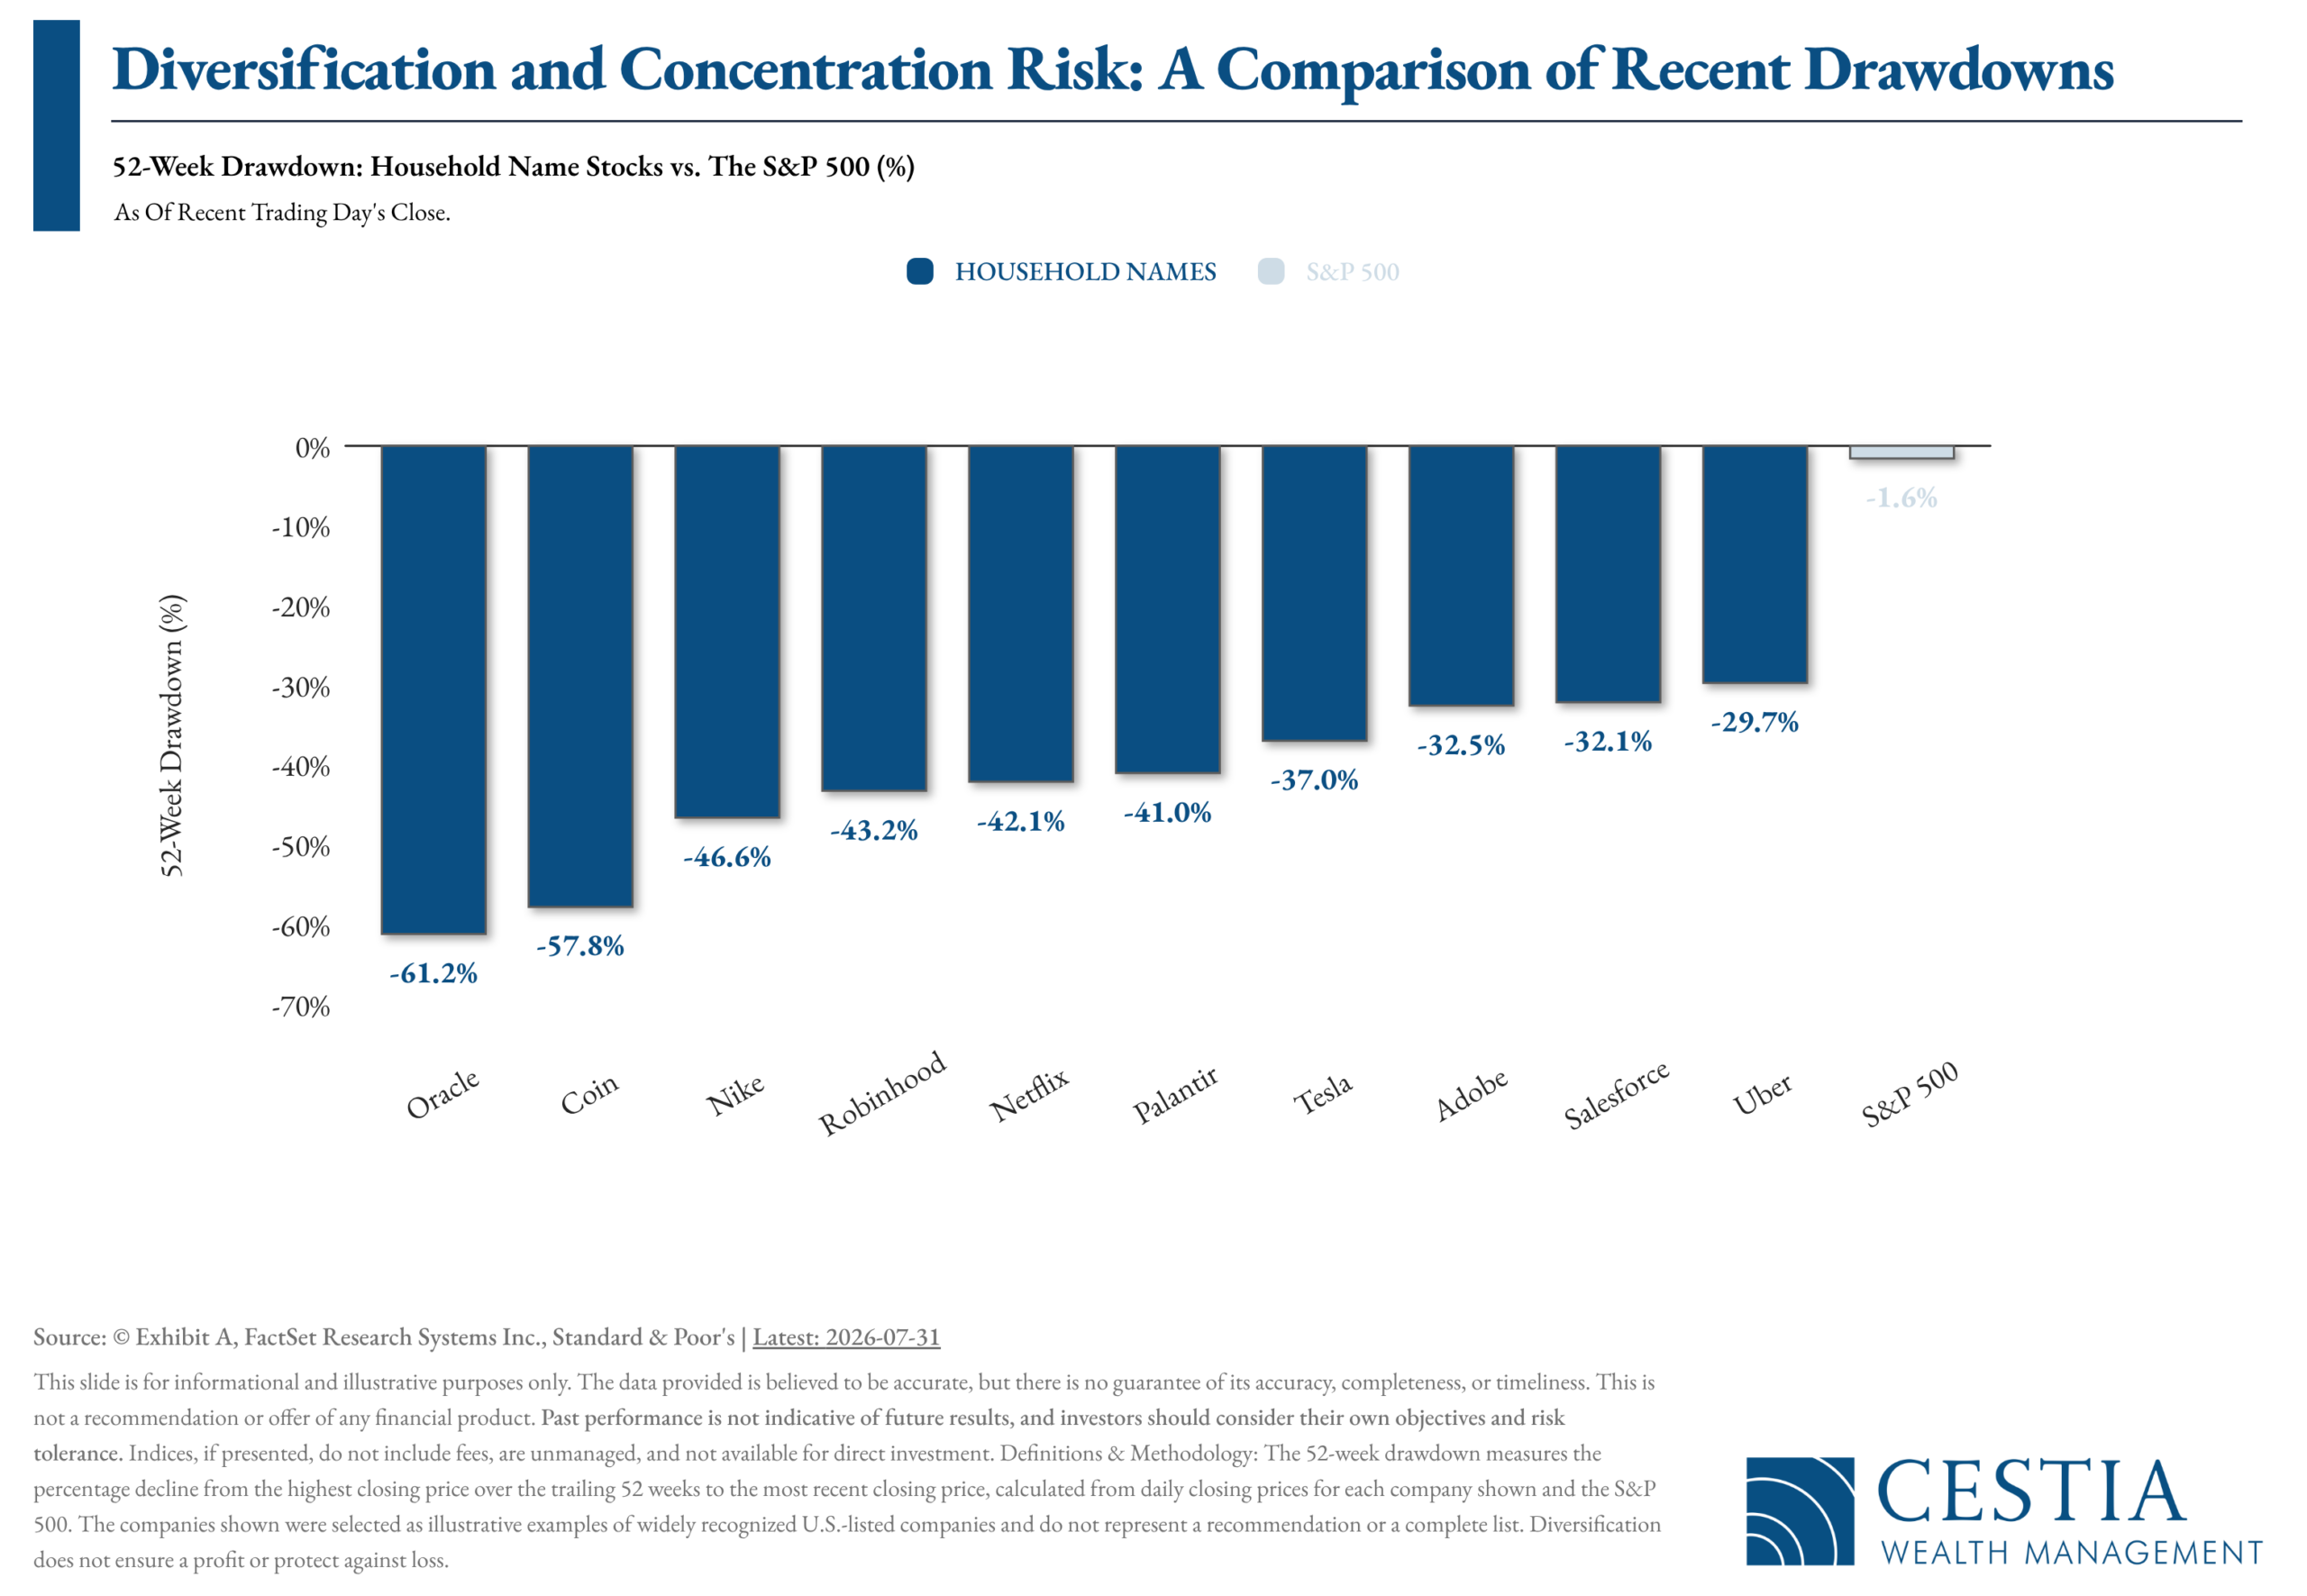
This week’s chart examines the 52-week drawdown — the percentage decline from a stock’s highest price over the trailing year to its most recent price — for a group of well-known household names, set alongside the S&P 500 for context.
The individual companies shown currently sit materially further below their 52-week highs than the index itself. That gap illustrates a pattern worth noting: even widely recognized, established businesses can experience deep and prolonged pullbacks, while a broad market index — composed of hundreds of companies — has moved through the same period with far less erosion from its own high.
Investment Implications
The contrast reflects a structural difference, not a coincidence. A diversified index does not depend on the fortunes of any single company; strength in some names can offset weakness in others. Individual securities, by contrast, carry the full weight of their own business results, competitive pressures, and market sentiment. This week’s chart is a reminder that headlines about “the market” and headlines about a specific stock can tell very different stories — and that diversification remains one of the more durable tools for managing that difference over time.

Bond Markets Throw Shade on New Fed Chair’s Inflation Strategy
Rule Changes Could Make This Charitable Giving Vehicle Even More Popular

Should you self-fund long-term care?
Most older adults will need some form of long‑term care, but the level, duration, and cost are hard to forecast. Some people who qualify for insurance may opt to self-fund, while others may benefit from a blended approach using both insurance and savings. If you’re considering self-funding, it’s important to assess which assets are available and liquid, tax implications, and how that plan may align with inheritance goals.
Download Fidelity’s Self-funding long-term care article
 The equity market’s resilience over the past two months has been notable. Despite acute weakness in some of the index’s largest names (including the Magnificent 7), a leverage unwind in the year’s most popular trade — semiconductors and AI infrastructure — a shift toward both greater Fed hawkishness and Fed uncertainty that has lifted yields across the curve, and continued Middle East tensions, the S&P 500 has shown remarkably little volatility. At its maximum drawdown the index was down only about 4% from its highs — too shallow to qualify as a correction or even a pullback, which NewEdge has characterized as a “wobble.” The index is now rebounding robustly, propelled by the Magnificent 7, a cohort that had lagged year-to-date and seen its group valuation fall by roughly a third over the past nine months. Given the Mag 7’s weight in the index (over 30%), outsized moves in these names carry outsized impact on returns.
This week brings another wave of earnings alongside key labor data, with nonfarm payrolls on Friday. Consensus looks for 80k jobs added and a stable 4.2% unemployment rate — a print that will shape expectations for Fed action at the September meeting, where the market currently prices a 63% probability of a hike. The move higher in long-term yields following last week’s meeting — including a push to new highs in the 30-Year TIPS yield — speaks to the bond market’s growing unease about a potentially complacent Fed, sticky inflation, and heavy debt supply from both public and private issuers

(as of Monday’s Market Opening)
| Total Return (1D) | Total Return (1W) | Total Return (MTD) | Total Return (QTD) | Total Return (YTD) | |
| S&P 500 | 0.70% | 1.03% | 0.00% | -0.13% | 9.41% |
| Dow Jones Industrial Average | 0.53% | 0.53% | 0.00% | 0.32% | 9.20% |
| NASDAQ | 1.00% | 1.77% | 0.00% | -3.20% | 9.17% |
| NASDAQ 100 | 0.60% | 0.84% | 0.00% | -6.61% | 11.98% |
| Russell 1000 | 0.64% | 1.04% | -0.27% | -0.27% | 9.84% |
| Russell 2000 | -0.48% | 0.01% | -3.08% | -3.08% | 18.79% |
| Russell 3000 | 0.58% | 1.00% | -0.36% | -0.36% | 10.30% |
| ACWI | 0.49% | 1.38% | -0.34% | -0.34% | 11.28% |
Global Client Survey
We’re inviting you to take part in a quick, anonymous client survey. Your feedback helps us fine-tune our process, elevate your experience, and ensure we’re delivering what matters most to you. This isn’t just about checking a box—it’s about shaping the future of how we serve you. Your voice helps guide our next steps. We’re listening. We’re learning. And we’re grateful for your trust.
Take Our Survey Now (click here)
Disclosures
- Wealth Mechanics™ is a registered trademark of Cestia Wealth Management. Unauthorized use of the trademark, including but not limited to commercial use, reproduction, or imitation without explicit written permission from Cestia Wealth Management, is strictly prohibited.
- Market commentary provided by NewEdge Advisors
- Charts concerning market data are provided by Exhibit A.
- Guides and other downloadable firm material respective to financial planning processes and data are provided and powered by fpPathfinder.
- Advisory services offered through NewEdge Advisors, LLC, a registered investment adviser. Securities offered through NewEdge Securities, LLC. Member FINRA/SIPC. NewEdge Advisors, LLC and NewEdge Securities, LLC are wholly owned subsidiaries of NewEdge Capital Group, LLC.
- Cestia Wealth Management is not a legal tax professional. We offer tax gap analysis for clients who desire to have a comprehensive financial plan, which requires in-depth tax strategy and planning as a distinct part of the overall customized solution. Please consult your tax professional on all matters addressed in this report.
- Information about annuities are not to be considered a recommendation. The information provided should not considered a recommendation to purchase or sell any particular security.
- Investing involves risk, including the potential loss of principal. No investment strategy can guarantee a profit or protect against loss in periods of declining values. Past performance is no guarantee of future results. Please note that individual situations can vary. Therefore, the information presented here should only be relied upon when coordinated with individual professional advice.
