



Week Ending September 4, 2026
Openings and Job Seekers Reach Equilibrium
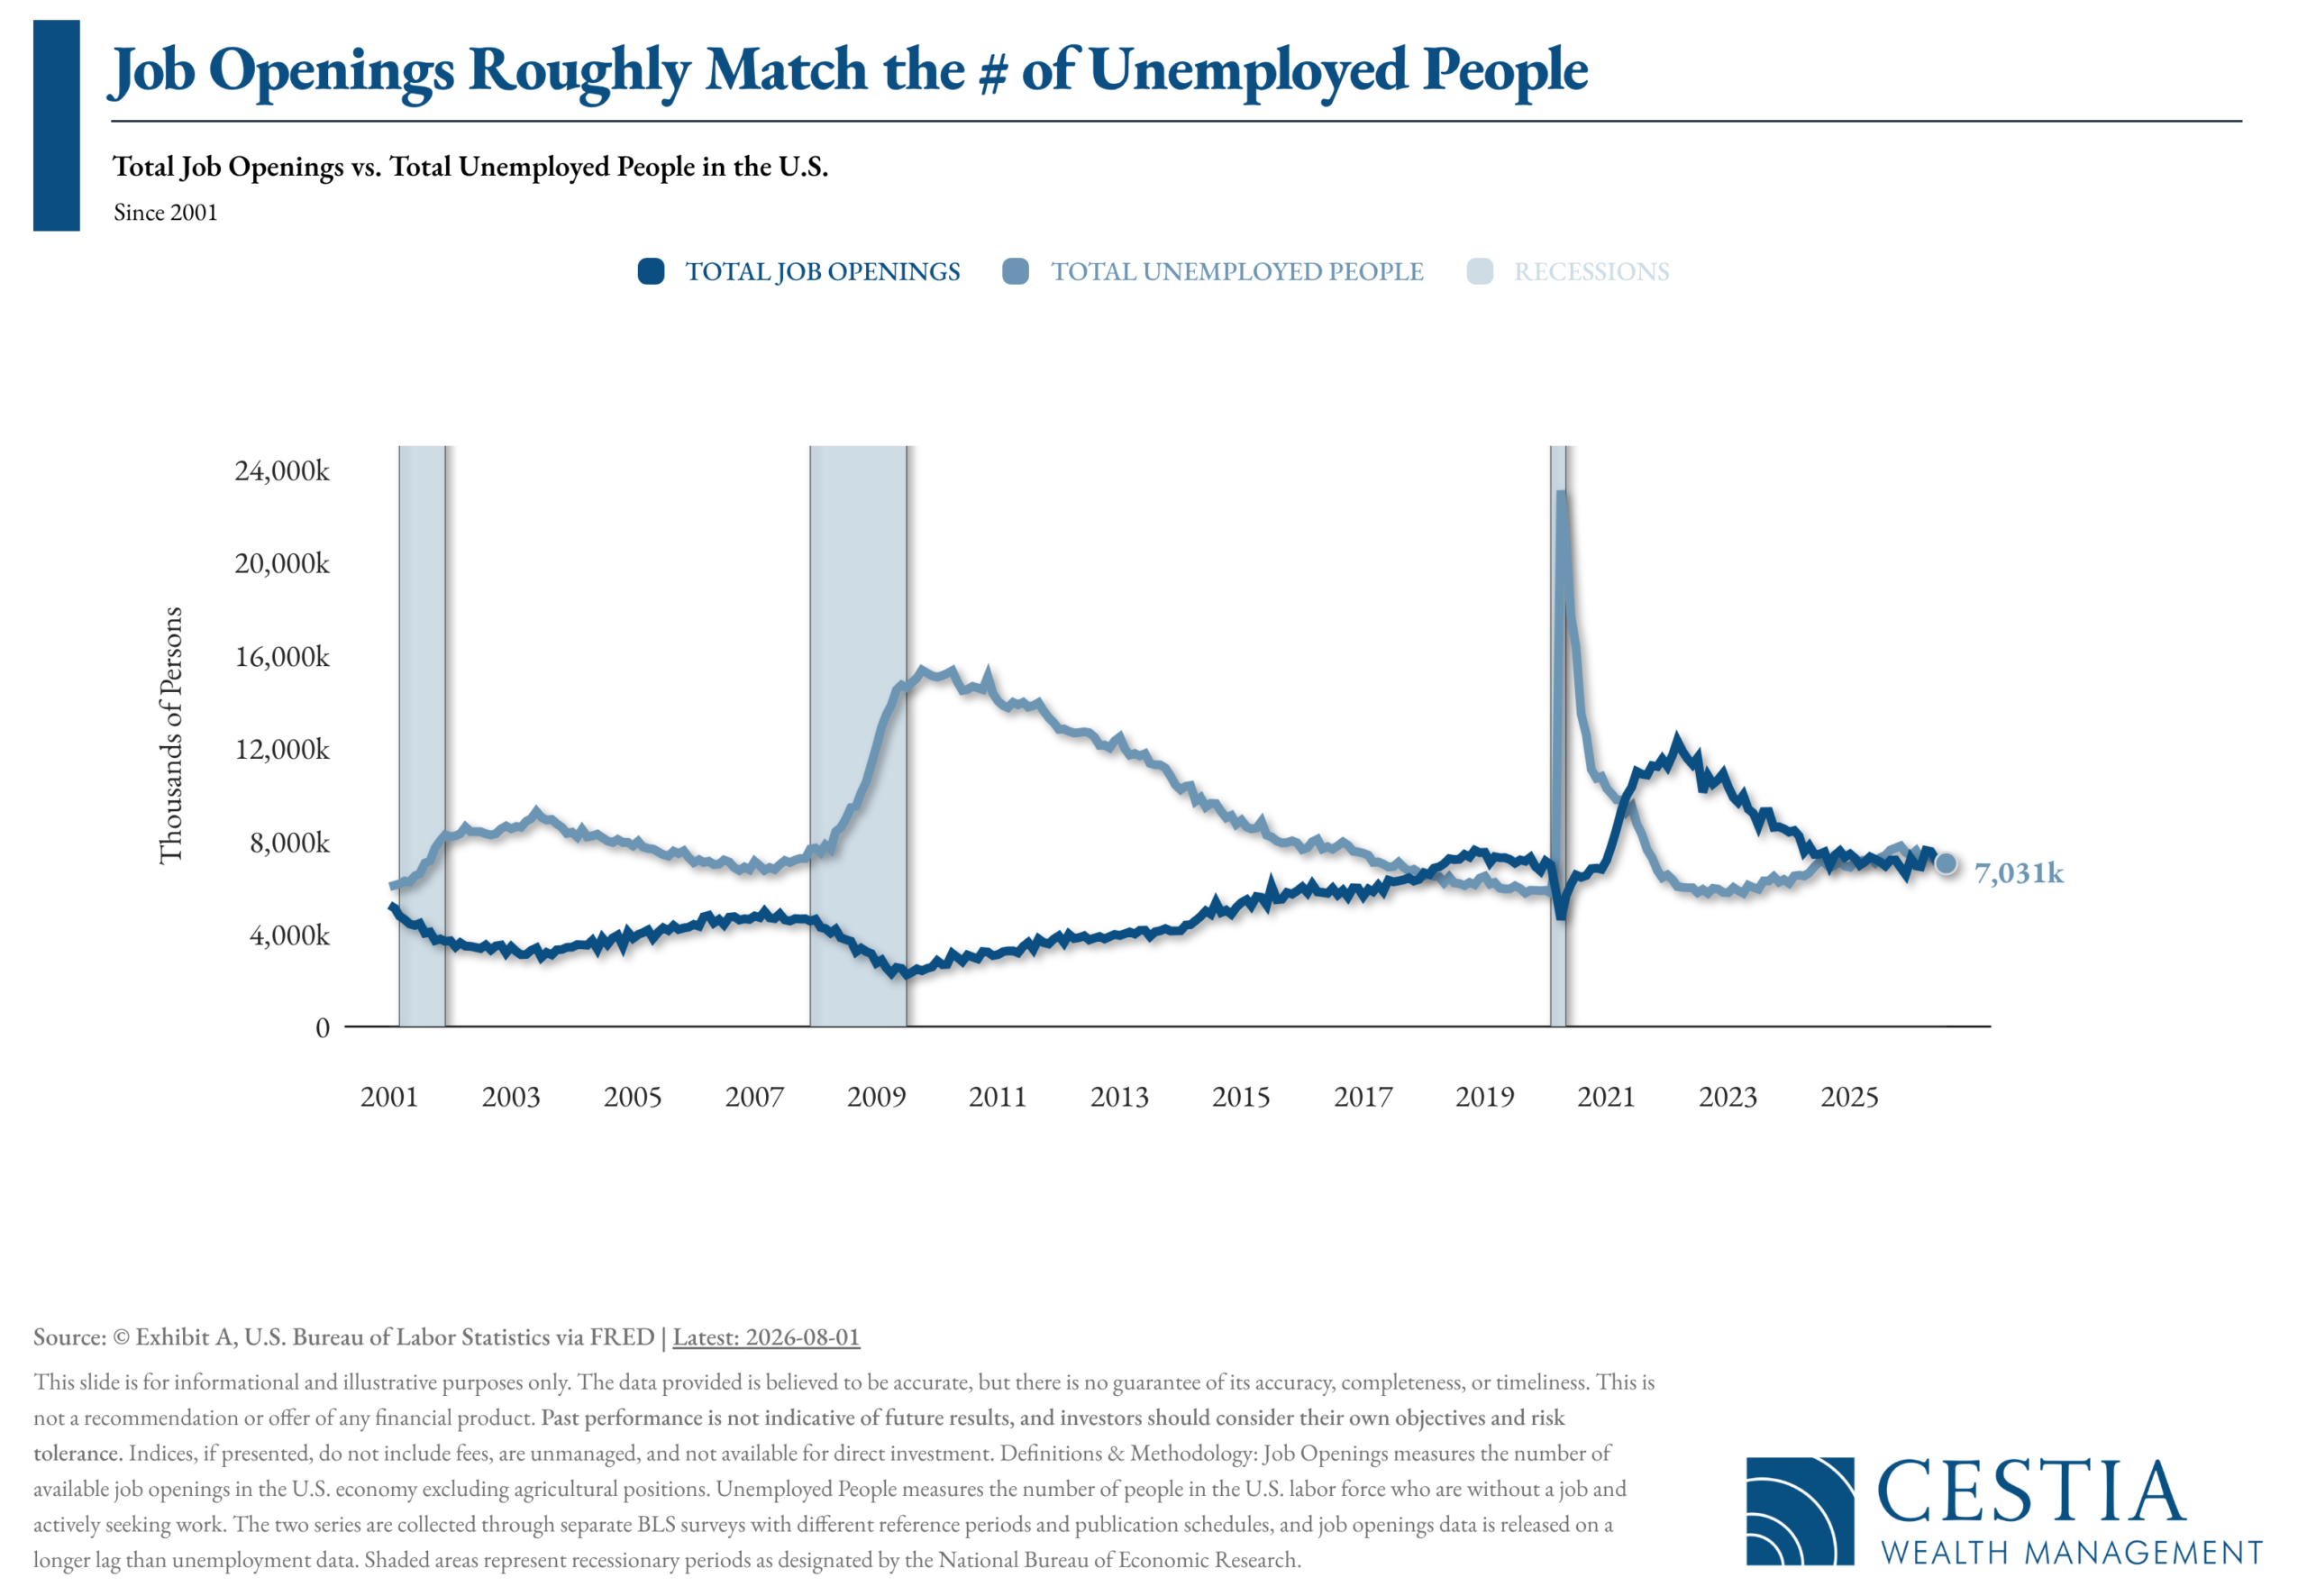
This week’s chart places two labor market series side by side: job openings, which measure the positions employers are actively trying to fill, and unemployed persons, meaning individuals in the labor force who are without work and looking for it. Shaded bars mark prior recessions.
As of July 2026, there were 7,271,000 job openings against 7,031,000 unemployed persons — roughly one available position for every person seeking one. Openings rose by 89,000 from a downwardly revised June figure of 7,182,000, coming in modestly below expectations of 7.30 million, a result the Bureau of Labor Statistics characterized as little changed.
The historical context is what gives the current reading its significance. For most of this series’ history, unemployed persons outnumbered available positions, and following the 2008 financial crisis the gap widened to more than two to one. Since 2021, the two lines have converged into near balance — an unusually durable condition by historical standards.
Investment implications: A one-to-one ratio describes a labor market that is neither overheating nor deteriorating, and that balance carries weight in Federal Reserve deliberations, where the openings-to-unemployed ratio remains a closely watched gauge of labor market slack. For investors, equilibrium of this kind supports consumer spending and corporate revenue without generating the wage pressure that complicates the inflation outlook. The figure worth monitoring is not the level but the direction: a sustained decline in openings while the unemployed count holds steady would mark the first genuine loosening in this cycle.


What Issues Should I Consider When Reviewing My Investments?
It is critical to review your investment portfolios as part of the financial planning process. Particularly during times of uncertainty and volatility, a portfolio review can help you evaluate and confirm their strategy, ensuring alignment with their financial goals.
This checklist helps guide your conversations with your advisor when reviewing their investment portfolios, and covers:
- Investment objectives
- Time horizon and risk tolerance
- Diversification and asset allocation
- Tax management, including capital gains and the NIIT
- Performance monitoring

September is typically the weakest month of the year for S&P 500 returns, with the index also often experiencing heightened volatility, mostly in the lead-up to a midterm election. This year, September has gotten off to a more resilient start, with the S&P 500 rebounding off support at its 50-day moving average, though NewEdge does not rule out volatility as the month progresses. With second-quarter earnings season now behind the market, potential catalysts for volatility this week could include hotter inflation data (PPI Thursday and CPI Friday), further upward pressure in oil prices, a continued rise in yields, and a shift toward rate hikes from the Fed, with the FOMC meeting next Wednesday.
Despite the potential for near-term volatility, this week’s research looks at how growth fears appear largely absent from the market. The underperformance of utilities alongside the outperformance of banks paints a picture of a market pricing in higher rates without yet viewing those rates as restrictive to growth. As the market enters the final months of 2026, the consumer bears close watching: inflation continues to erode purchasing power, and the tax-reform benefits that helped buffer spending in the second quarter cannot be counted on to offset higher energy spending in the second half of the year.

(as of Monday’s Market Opening)
| Total Return (1D) | Total Return (1W) | Total Return (MTD) | Total Return (QTD) | Total Return (YTD) | |
| S&P 500 | -0.36% | 0.78% | 0.06% | 2.55% | 12.35% |
| Dow Jones Industrial Average | -1.02% | 0.19% | -0.60% | 1.05% | 10.00% |
| NASDAQ | -0.28% | 1.27% | 0.23% | 0.83% | 13.72% |
| NASDAQ 100 | -0.57% | 1.03% | -0.27% | -2.97% | 16.34% |
| Russell 1000 | -0.34% | -0.26% | 0.05% | 2.58% | 12.99% |
| Russell 2000 | -0.25% | -0.17% | 0.45% | -1.73% | 20.44% |
| Russell 3000 | -0.35% | -0.21% | 0.10% | 2.39% | 13.33% |
| ACWI | -0.19% | 0.30% | 0.56% | 2.94% | 14.94% |
Global Client Survey
We’re inviting you to take part in a quick, anonymous client survey. Your feedback helps us fine-tune our process, elevate your experience, and ensure we’re delivering what matters most to you. This isn’t just about checking a box—it’s about shaping the future of how we serve you. Your voice helps guide our next steps. We’re listening. We’re learning. And we’re grateful for your trust.
Take Our Survey Now (click here)
Disclosures
- Wealth Mechanics™ is a registered trademark of Cestia Wealth Management. Unauthorized use of the trademark, including but not limited to commercial use, reproduction, or imitation without explicit written permission from Cestia Wealth Management, is strictly prohibited.
- Market commentary provided by NewEdge Advisors
- Charts concerning market data are provided by Exhibit A.
- Guides and other downloadable firm material respective to financial planning processes and data are provided and powered by fpPathfinder.
- Advisory services offered through NewEdge Advisors, LLC, a registered investment adviser. Securities offered through NewEdge Securities, LLC. Member FINRA/SIPC. NewEdge Advisors, LLC and NewEdge Securities, LLC are wholly owned subsidiaries of NewEdge Capital Group, LLC.
- Cestia Wealth Management is not a legal tax professional. We offer tax gap analysis for clients who desire to have a comprehensive financial plan, which requires in-depth tax strategy and planning as a distinct part of the overall customized solution. Please consult your tax professional on all matters addressed in this report.
- Information about annuities are not to be considered a recommendation. The information provided should not considered a recommendation to purchase or sell any particular security.
- Investing involves risk, including the potential loss of principal. No investment strategy can guarantee a profit or protect against loss in periods of declining values. Past performance is no guarantee of future results. Please note that individual situations can vary. Therefore, the information presented here should only be relied upon when coordinated with individual professional advice.
