



August 15, 2025
WEEKLY TOUCHPOINT
The Power of Seven
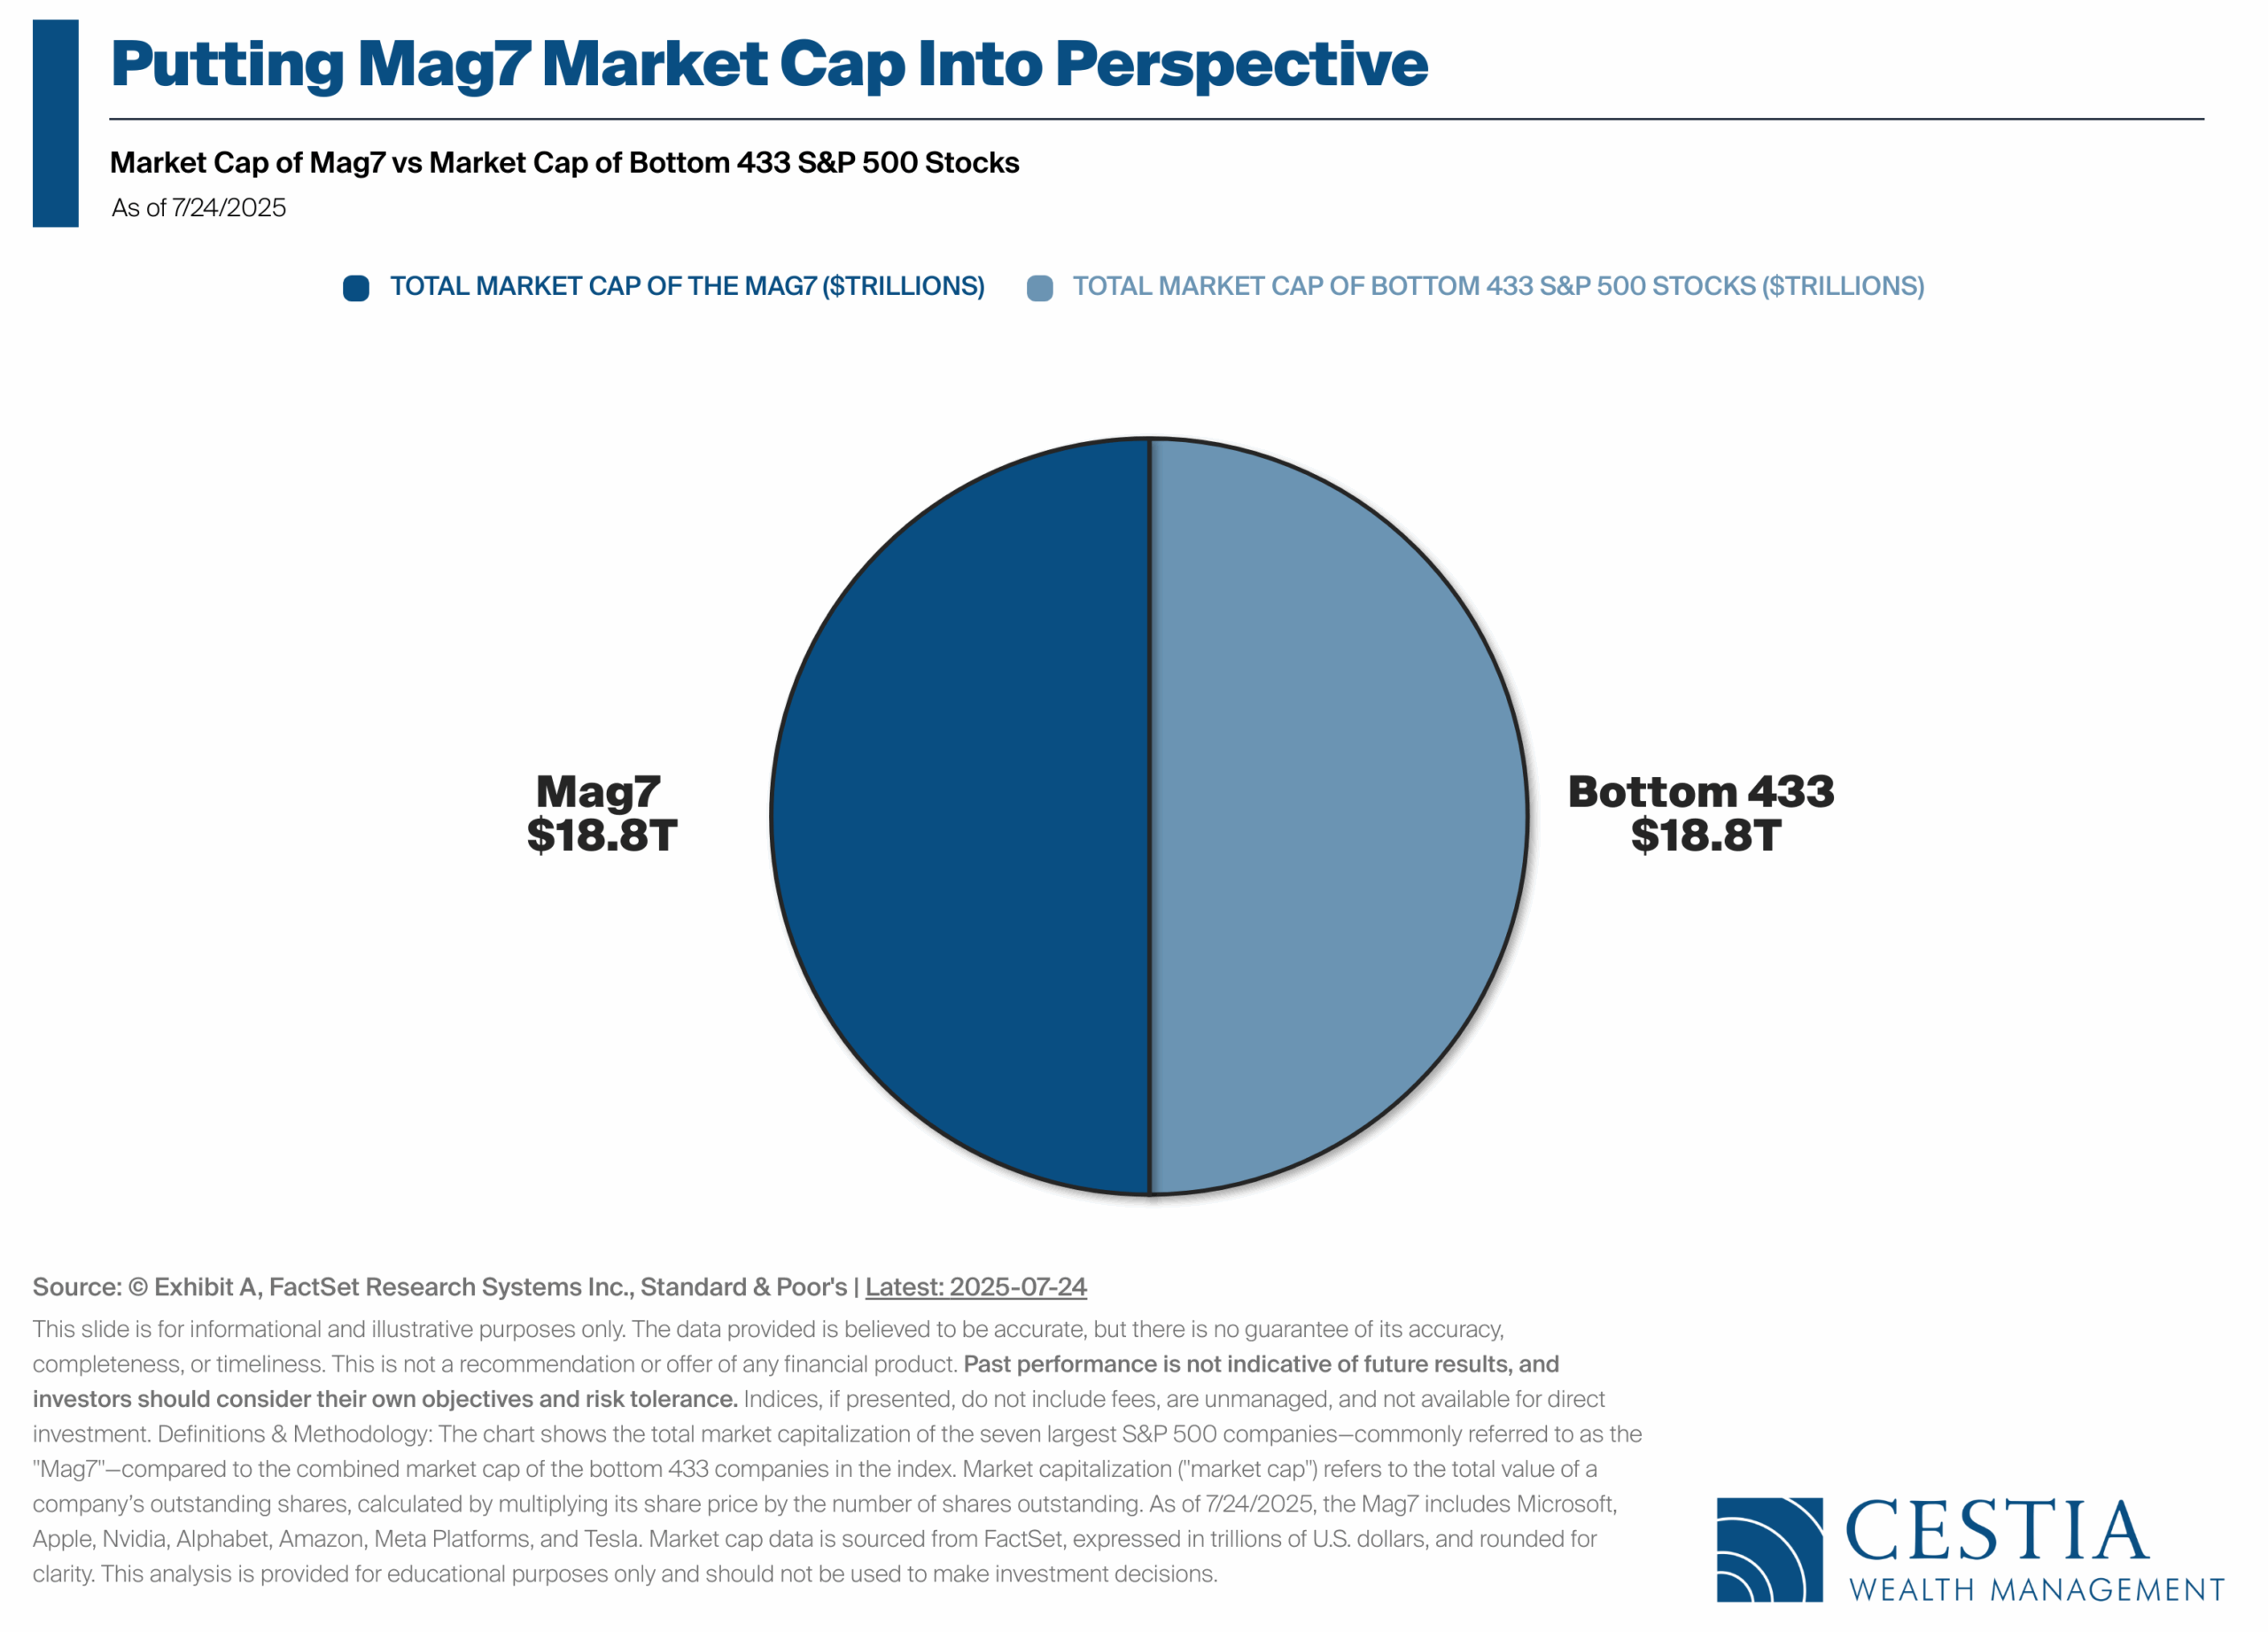
As of July 24, 2025, just seven companies—the so-called “Mag7”—hold as much market value as the bottom 433 stocks in the S&P 500 combined. Each of these giants averages around $2.7 trillion in market cap, while the other 433 average just $43 billion apiece.
That kind of scale creates a market that feels balanced on a knife’s edge—where a handful of stocks can drive index returns and mask what’s happening underneath. It’s a striking reminder: diversification isn’t just a buzzword, it’s a safeguard.
👉 CTA: Curious how concentrated markets could impact your portfolio? Let’s talk through what true diversification looks like for you.
NEWS
- Watch the Video: Fidelity’s Market Sense explores whether the Fed will lower rates at their September meeting.
-
Warren Buffett Reveals Multibillion-Dollar Pre-Retirement Bets
-
PPI inflation shock: Core producer prices hit 3-year high in July
-
Oil Drilling Stuck Near 4-Year Lows, Thanks to Energy Policy Puzzle
Wealth Mechanics™
What Issues Should I Consider When Reviewing My Investments?
Whether you’re a seasoned investor or just starting out, reviewing your portfolio is one of the most important steps in staying on track toward your goals. In today’s environment—where volatility and uncertainty can test even the best strategies—taking the time to step back and assess your investments can bring clarity and confidence.
A portfolio review helps confirm whether your investments still align with your broader financial plan. It’s also a powerful way to uncover opportunities—whether it’s improving diversification, rebalancing risk, or managing taxes more efficiently.
Here are some key issues worth revisiting during a review:
-
Investment objectives: Do your holdings reflect your goals today—not the goals you had five years ago?
-
Time horizon and risk tolerance: Has anything changed in your life that might shift how much risk you’re willing or able to take?
-
Diversification and asset allocation: Is your portfolio built to weather different market environments, or is it leaning too heavily on just a few names or sectors?
-
Tax management: Are you keeping an eye on capital gains, losses, and the Net Investment Income Tax (NIIT)?
-
Performance monitoring: Beyond returns, are your investments actually doing the job they’re meant to do in your plan?
👉 CTA: A thoughtful review can make all the difference. If you’d like a fresh set of eyes on your portfolio—or a second opinion—we’d be happy to walk through this checklist together.
DOWNLOAD GUIDE NOW
Source: fp Pathfinder
MARKET COMMENTARY
Equities
-
Stocks rallied as softer inflation data boosted hopes for a September Fed rate cut.
-
Earnings stayed strong, with 81% of S&P 500 companies beating Q2 expectations—the best showing since late 2023.
-
Small caps led the way, as the Russell 2000 outperformed the S&P 500 by the widest margin since April.
-
Health care surged (+4.7%), helped by Berkshire Hathaway’s $1.6B stake in UnitedHealth; consumer discretionary also gained.
-
Defensive sectors like staples and utilities lagged, while foreign equities outpaced U.S. markets on upbeat GDP data.
Bonds
-
Treasury yields fell to their lowest levels since May on Fed easing expectations.
-
The 2-year Treasury dropped to 3.75%, while the 10-year ended higher at 4.33%.
-
Investment-grade corporate yields declined to 4.96%; high-yield corporates dropped to 7.25%.
-
High-yield bonds delivered broad positive returns in a steadier macro environment.
Macroeconomic Data
-
Inflation readings were mostly in line: headline CPI up 0.2% in July, core CPI up 0.3%.
-
Producer prices rose sharply (+0.9%), pushing annual wholesale inflation to 3.3%, a five-month high.
-
Retail sales climbed 0.5%, with auto sales leading as buyers rushed ahead of expected price hikes.
-
Small business optimism rose above its 52-year average, while consumer sentiment slipped to a three-month low on tariff and labor concerns.
INDEX RETURNS
(as of Monday’s Market Opening)
| Total Return (1D) | Total Return (1W) | Total Return (MTD) | Total Return (QTD) | Total Return (YTD) | |
| S&P 500 | -0.05% | 1.15% | 1.69% | 3.90% | 9.61% |
| Dow Jones Industrial Average | -0.04% | 2.16% | 1.80% | 1.89% | 5.60% |
| NASDAQ | -0.13% | 0.98% | 2.24% | 6.01% | 11.83% |
| NASDAQ 100 | -0.09% | 0.70% | 2.04% | 4.47% | 12.75% |
| Russell 1000 | -0.08% | 1.16% | 1.61% | 3.95% | 10.14% |
| Russell 2000 | 0.39% | 3.52% | 3.93% | 5.67% | 3.71% |
| Russell 3000 | -0.09% | 1.21% | 1.76% | 4.07% | 9.85% |
| ACWI | -0.12% | 1.30% | 2.51% | 3.60% | 14.26% |
Source: MorningStar
Global Client Survey
We’re inviting you to take part in a quick, anonymous client survey. Your feedback helps us fine-tune our process, elevate your experience, and ensure we’re delivering what matters most to you. This isn’t just about checking a box—it’s about shaping the future of how we serve you. Your voice helps guide our next steps. We’re listening. We’re learning. And we’re grateful for your trust.
Take Our Survey Now (click here)
Disclosures
- Wealth Mechanics™ is a registered trademark of Cestia Wealth Management. Unauthorized use of the trademark, including but not limited to commercial use, reproduction, or imitation without explicit written permission from Cestia Wealth Management, is strictly prohibited.
- Market commentary provided by NewEdge Advisors
- Charts concerning market data are provided by Exhibit A.
- Guides and other downloadable firm material respective to financial planning processes and data are provided and powered by fpPathfinder.
- Advisory services offered through NewEdge Advisors, LLC, a registered investment adviser. Securities offered through NewEdge Securities, LLC. Member FINRA/SIPC. NewEdge Advisors, LLC and NewEdge Securities, LLC are wholly owned subsidiaries of NewEdge Capital Group, LLC.
- Cestia Wealth Management is not a legal tax professional. We offer tax gap analysis for clients who desire to have a comprehensive financial plan, which requires in-depth tax strategy and planning as a distinct part of the overall customized solution. Please consult your tax professional on all matters addressed in this report.
- Information about annuities are not to be considered a recommendation. The information provided should not considered a recommendation to purchase or sell any particular security.
- Investing involves risk, including the potential loss of principal. No investment strategy can guarantee a profit or protect against loss in periods of declining values. Past performance is no guarantee of future results. Please note that individual situations can vary. Therefore, the information presented here should only be relied upon when coordinated with individual professional advice.
