



October 24, 2025
WEEKLY TOUCHPOINT
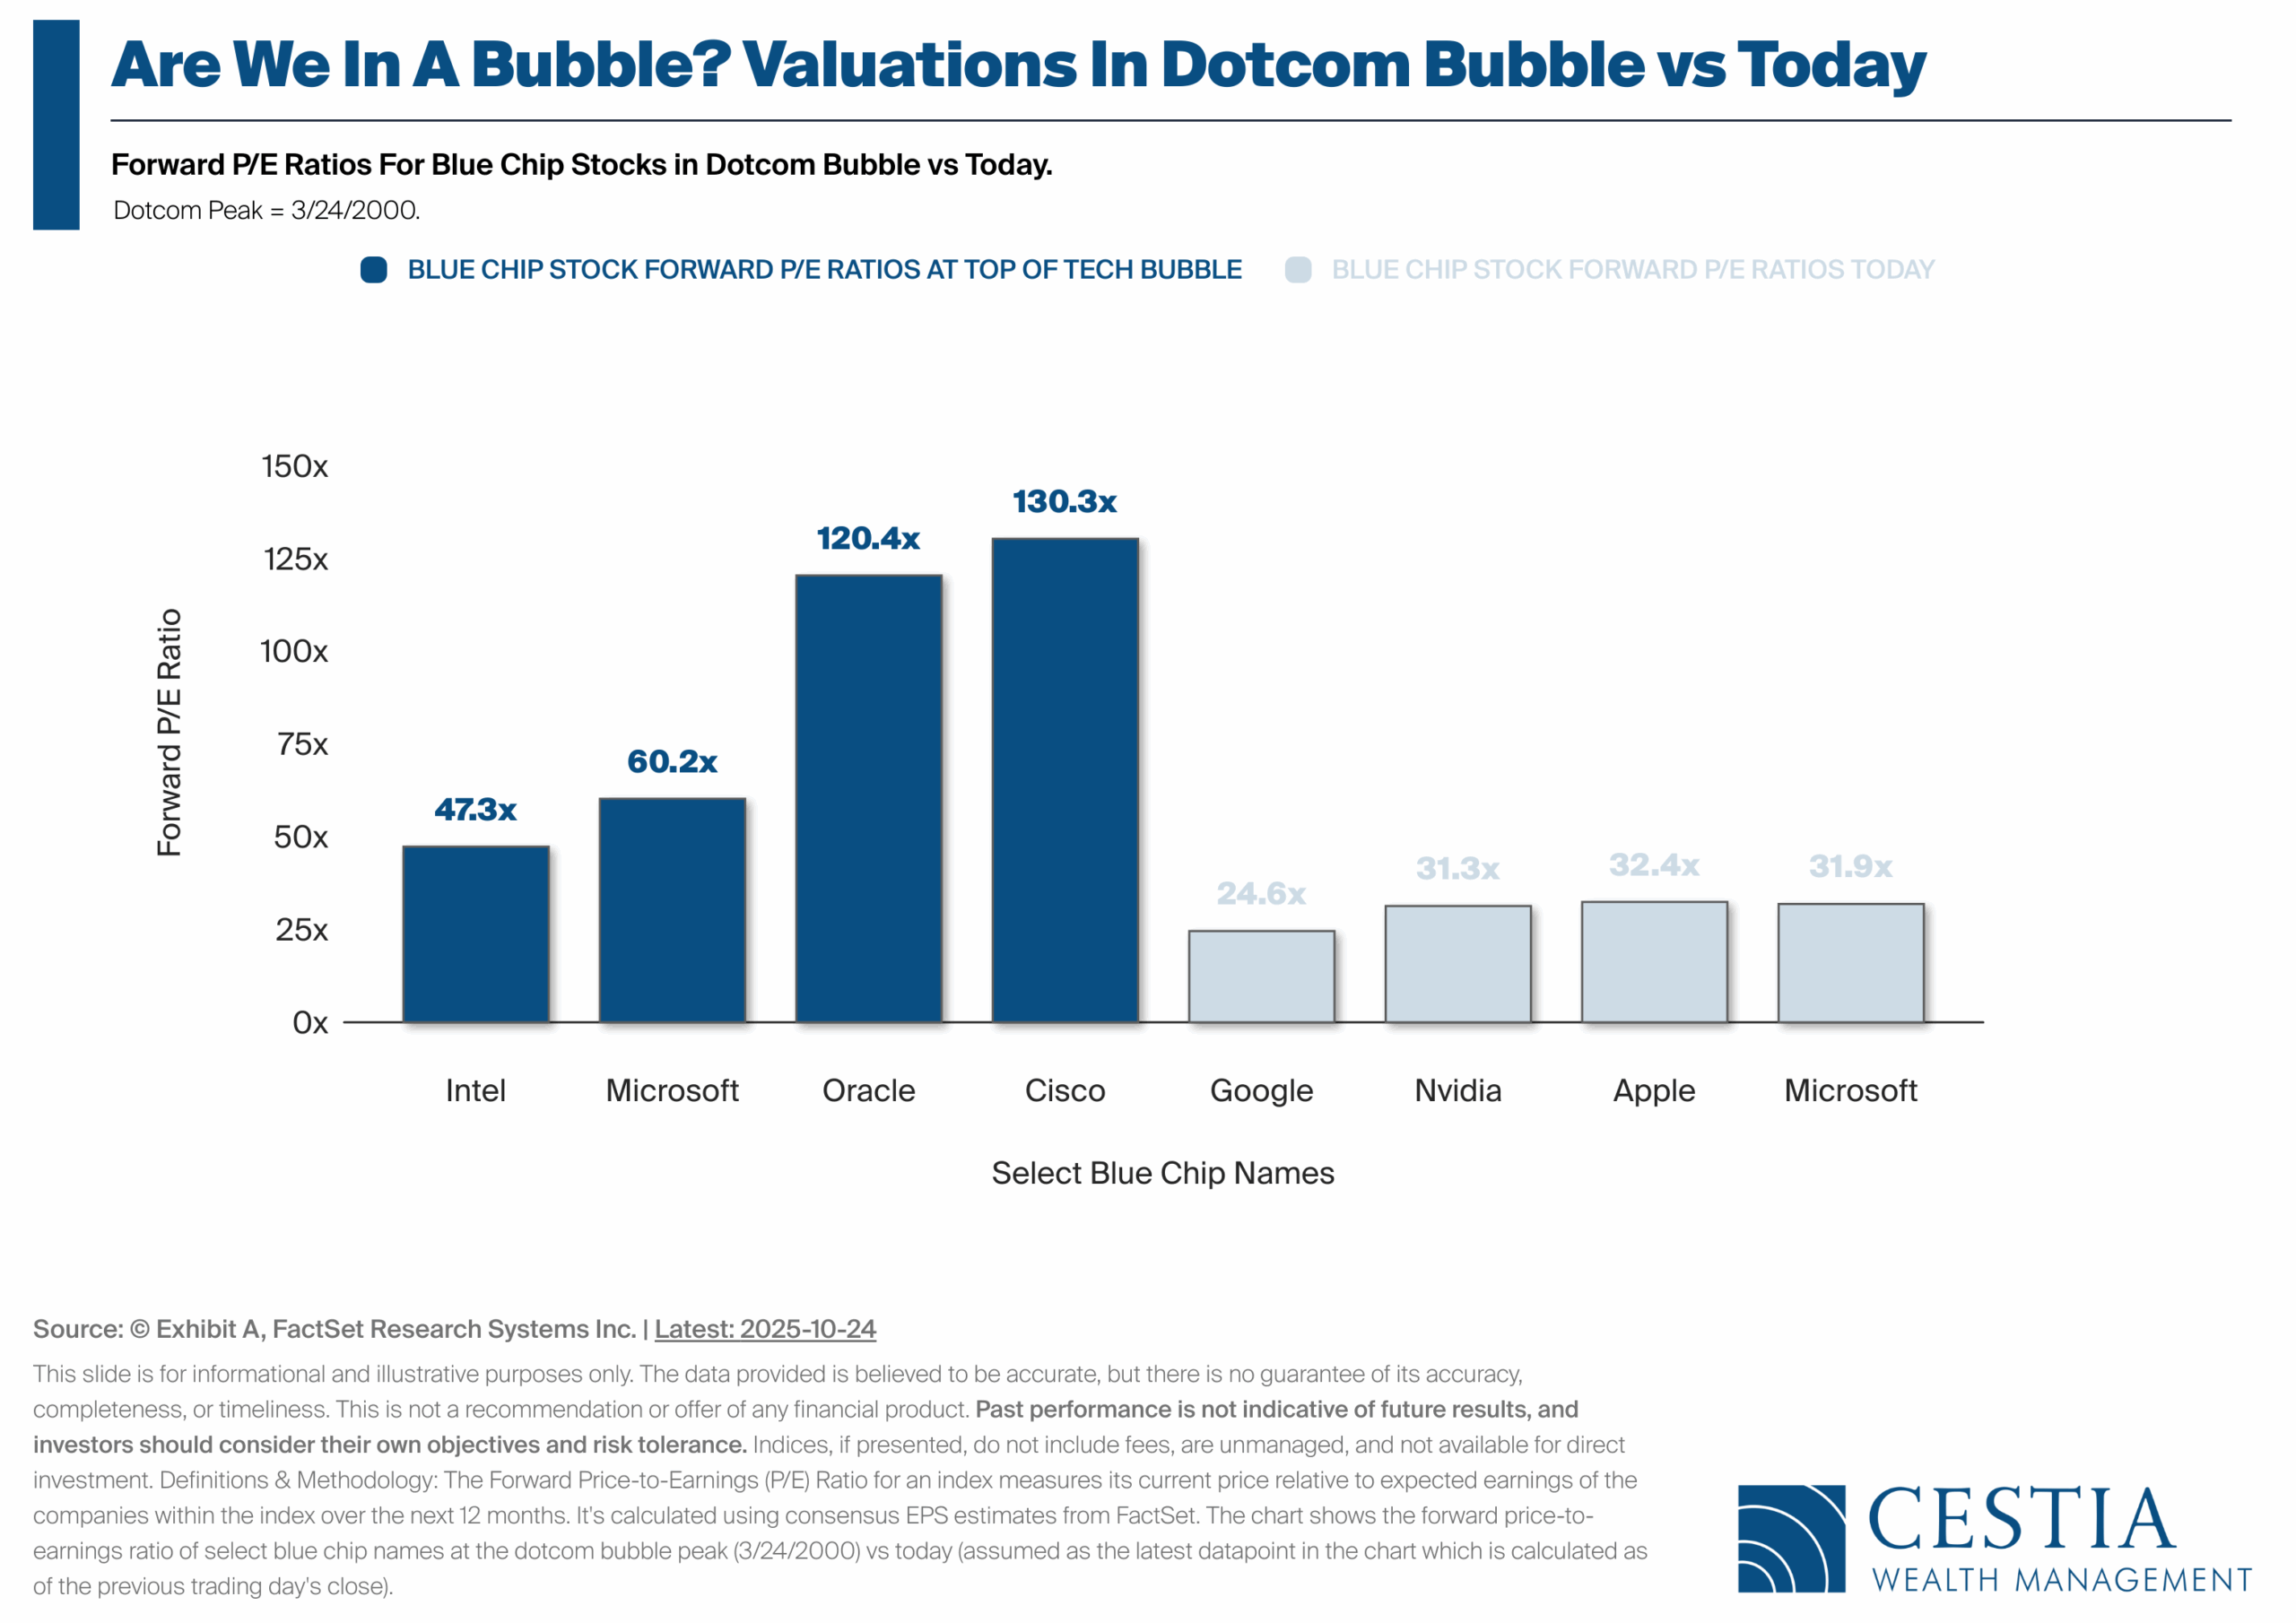
Are We in a Stock Market Bubble?
At the height of the dotcom bubble in 2000, blue-chip tech names like Cisco and Oracle traded at sky-high valuations—often more than 100 times forward earnings. Fast-forward to today, and while valuations have certainly climbed in recent years, the picture looks far more grounded.
Today’s market leaders boast stronger fundamentals, broader revenue streams, and far greater profitability than their dotcom-era counterparts. For investors, it’s a reminder that while prices matter, context matters more — and the current environment reflects real earnings power, not speculative hype.

Homebuyers Are Scoring the Biggest Autumn Discounts Since 2019
US rolls back some tariffs on products that can’t be grown
Gold Rush Loses Momentum in Runup to Newmont Earnings
Oil Spikes as US Sanctions Russian Producers to Undermine Putin’s War Machine
Stampeding Bull Market Will Keep Bears at Bay for Another Year, Investors Predict

What Issues Should I Consider When Dealing With High Inflation?
Inflation touches nearly every corner of a financial plan — from groceries and gas to investment returns and taxes. When prices rise, it’s natural to wonder how to protect your purchasing power and stay on track toward long-term goals.
Here are a few areas we help clients focus on during periods of elevated inflation:
- Cash Flow & Budgeting: Adjusting spending plans to reflect today’s higher costs while maintaining savings goals.
- Asset Protection: Reviewing portfolios for assets that can help preserve real value and offset inflation pressures.
- Tax Opportunities: Exploring strategies that take advantage of inflation-adjusted thresholds or tax-efficient investments.
- Holistic Planning: Reassessing insurance, retirement income, and estate strategies that could be impacted by inflation.
Our goal: keep your plan resilient—no matter how the cost of living changes.
Source: Financial Advisor publication

Equities
• The S&P 500 climbed to a new all-time high, shrugging off higher oil prices after U.S. sanctions on Russia’s two largest oil companies.
• Nearly 30% of S&P 500 firms have reported earnings — 87% beat estimates and 83% topped revenue forecasts, the strongest pace since mid-2021.
• Smaller-cap companies outperformed larger peers, while sector leadership was broad with nine of eleven sectors advancing.
• Tech and industrials drove much of the index’s gains and earnings momentum.
• Defensive areas like utilities and staples lagged, while emerging markets saw renewed strength despite trade headlines.
Bonds
• Bonds gained overall, as easing credit concerns supported long-duration and high-yield sectors.
• The two-year Treasury yield rose slightly to 3.48%, while the ten-year held steady at 4.02%, narrowing the 2-10yr spread to 0.54%.
• Longer-term bonds outperformed, with long-duration high-yield corporates leading fixed income gains.
• Investment-grade yields eased to 4.69%, and high-yield bonds declined to 7.11%.
• Investor demand remained firm, reflecting improving sentiment toward credit markets.
Macroeconomic Data
• Limited data releases during the ongoing government shutdown still offered a few bright spots.
• September CPI rose less than expected — headline +0.3% and core +0.2% — with housing costs cooling to their slowest pace since 2020.
• Year-over-year inflation held at 3.0%, still above the Fed’s target but moving in the right direction.
• Existing home sales climbed 1.5% in September, and prices rose modestly both monthly and annually.
• Services and manufacturing PMIs strengthened in October, signaling solid demand and output, though business confidence softened amid policy and tariff concerns.

(as of Monday’s Market Opening)
| Total Return (1D) | Total Return (1W) | Total Return (MTD) | Total Return (QTD) | Total Return (YTD) | |
| S&P 500 | 1.04% | 1.89% | 2.60% | 2.60% | 16.67% |
| Dow Jones Industrial Average | 0.54% | 1.61% | 2.29% | 2.29% | 11.55% |
| NASDAQ | 1.62% | 2.57% | 4.07% | 4.07% | 22.12% |
| NASDAQ 100 | 1.67% | 2.55% | 4.47% | 4.47% | 22.70% |
| Russell 1000 | 0.93% | 1.80% | 2.62% | 2.62% | 17.33% |
| Russell 2000 | 0.17% | 0.68% | 3.26% | 3.26% | 13.97% |
| Russell 3000 | 0.93% | 1.78% | 2.55% | 2.55% | 17.16% |
| ACWI | 0.85% | 1.46% | 2.77% | 2.77% | 21.84% |

Understanding Business Value: The “Insight” Framework
When valuing a privately held business, Insight questions help uncover what really drives value beyond the numbers. The assessment looks across six key areas that reveal both strengths and potential risks:
- Strategic Value – How the company competes: industry position, barriers to entry, pricing power, scalability, and brand recognition.
- Organizational Value – How well the business runs: systems, communication, leadership culture, cybersecurity, and governance processes.
- Employee Value – The people factor: management depth, tenure, incentives, and key-person dependencies.
- Customer Value – The health of the customer base: retention, concentration, satisfaction, and recurring revenue.
- Financial Value – The numbers: revenue trends, budgeting discipline, profitability, and forecasting accuracy.
- ESG Value – The stewardship lens: board independence, ethics, environmental impact, and social responsibility.
Together, these insights help business owners see what buyers or investors truly value — not just the financial statements, but the quality, resilience, and transferability of the enterprise itself.
SOURCE: The Exit Planning Institute
Global Client Survey
We’re inviting you to take part in a quick, anonymous client survey. Your feedback helps us fine-tune our process, elevate your experience, and ensure we’re delivering what matters most to you. This isn’t just about checking a box—it’s about shaping the future of how we serve you. Your voice helps guide our next steps. We’re listening. We’re learning. And we’re grateful for your trust.
Take Our Survey Now (click here)
Disclosures
- Wealth Mechanics™ is a registered trademark of Cestia Wealth Management. Unauthorized use of the trademark, including but not limited to commercial use, reproduction, or imitation without explicit written permission from Cestia Wealth Management, is strictly prohibited.
- Market commentary provided by NewEdge Advisors
- Charts concerning market data are provided by Exhibit A.
- Guides and other downloadable firm material respective to financial planning processes and data are provided and powered by fpPathfinder.
- Advisory services offered through NewEdge Advisors, LLC, a registered investment adviser. Securities offered through NewEdge Securities, LLC. Member FINRA/SIPC. NewEdge Advisors, LLC and NewEdge Securities, LLC are wholly owned subsidiaries of NewEdge Capital Group, LLC.
- Cestia Wealth Management is not a legal tax professional. We offer tax gap analysis for clients who desire to have a comprehensive financial plan, which requires in-depth tax strategy and planning as a distinct part of the overall customized solution. Please consult your tax professional on all matters addressed in this report.
- Information about annuities are not to be considered a recommendation. The information provided should not considered a recommendation to purchase or sell any particular security.
- Investing involves risk, including the potential loss of principal. No investment strategy can guarantee a profit or protect against loss in periods of declining values. Past performance is no guarantee of future results. Please note that individual situations can vary. Therefore, the information presented here should only be relied upon when coordinated with individual professional advice.
