



November 14, 2025
WEEKLY TOUCHPOINT
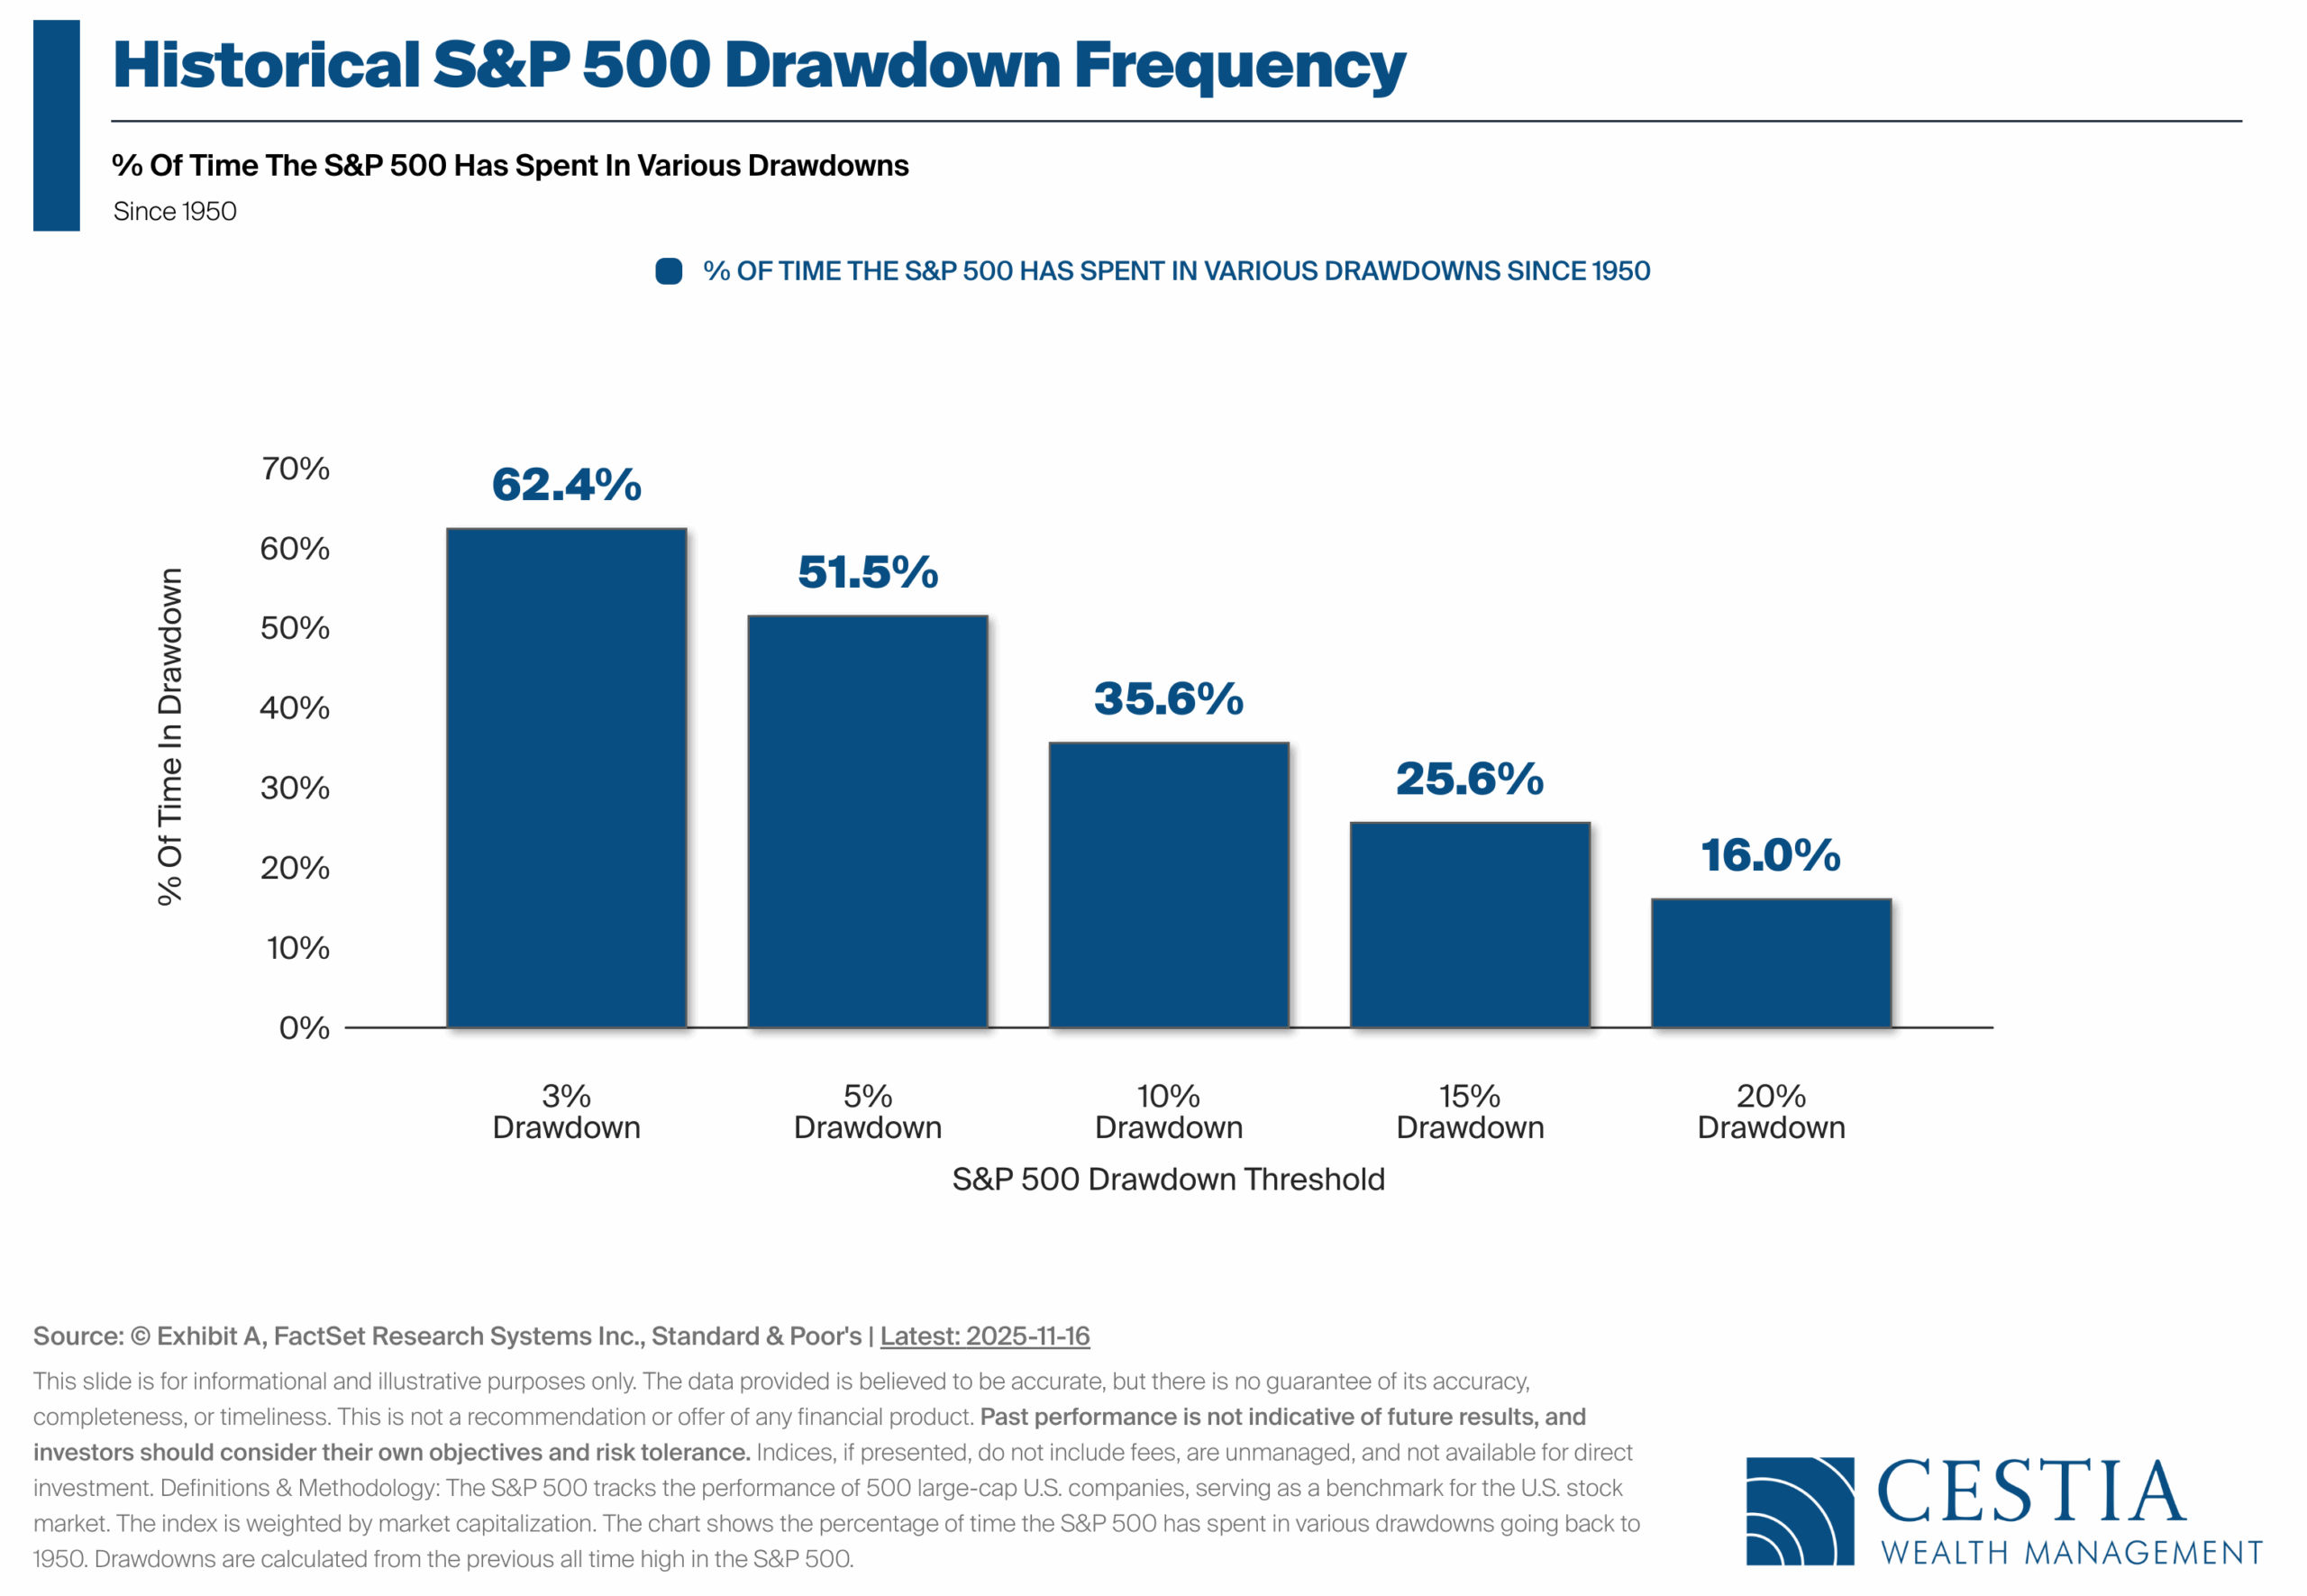
When we zoom out and look at decades of market history, one truth becomes crystal clear: pullbacks aren’t an anomaly—they’re the norm. A recent chart on S&P 500 drawdown frequency since 1950 helps put today’s volatility into perspective.
What the Data Shows
- The S&P 500 has spent over 60% of its time sitting at least 3% below its prior all-time high.
- More than half of all market days have lived with a 5% drawdown or worse.
- Even the bigger dips—10%+ declines—show up more often than we might expect.
- In other words: the market spends far more time recovering than it does setting all-time highs.
Why This Matters
- Market pullbacks are not red flags—they’re part of the natural rhythm of long-term investing.
- Knowing how often declines occur can help temper emotional reactions during tough weeks.
- Drawdowns typically reflect short-term noise, while long-term returns reflect economic growth and innovation.
- The data reinforces a simple truth: staying invested through turbulence has historically been the winning play.
What This Means for You
- Volatility is part of the price we pay for long-term growth.
- These historical patterns help us set expectations, stick to strategy, and avoid decisions driven by fear.
- When viewed through a long lens, temporary declines become just small chapters in a much larger wealth-building story.

Can the Fed Get Missing Economic Data in Time for Rate-Cut Decision?
Why Trump’s push for a 50-year mortgage could backfire
Russell 2000’s Good Fortune May Prove to Be a Bad Omen
The US will stop minting pennies within weeks
A December Rate Cut? Economists Still Expect One. Markets, Not so Much

What Will Have The Least Tax Impact: Harvesting Capital Gains Or Roth Conversions?
Clients often have outsized positions due to appreciation and large pre-tax retirement accounts. They may be looking to reduce portfolio risk and protect gains now, while also aiming to reduce their future income tax burden. Roth conversions and harvesting capital gains are two effective financial strategies that can achieve these goals; however, they accelerate income tax costs. There are current tax consequences associated with each strategy, and the issue becomes whether to accelerate ordinary income, capital gains, or a combination thereof.
Clients may struggle to choose the optimal balance between Roth conversions and harvesting capital gains. To help guide your conversations and the weighing of options, we have created this flowchart. It covers key considerations, including:
- Expected need and future goals for the assets
- Current tax brackets and the effect of increasing income (ordinary or capital gains)
- Projected future income and tax rates
- Collateral impact on Social Security, Medicare, wealth transfer goals, etc.
SOURCE: fpPathfinder
 Equities
- Early-week gains had investors feeling upbeat as hopes grew that the government shutdown might soon wrap up—lifting sentiment just enough to get things moving.
- The mood cooled later in the week as hawkish Fed commentary and renewed concerns about valuations and heavy AI spending applied pressure to the major indexes.
- The S&P 500 managed to eke out a 0.12% gain, supported by an earnings season that continues to shine—S&P 500 earnings are tracking ~13.1% growth, far ahead of expectations.
- Growth stocks hit a speed bump as AI-related spending came under the microscope, prompting a rotation toward value names; health care and energy led, while consumer discretionary and communication services lagged.
- Overseas markets enjoyed a lift, particularly Japan, where strong corporate earnings helped foreign equities outperform the U.S.
Bonds
- Treasuries slipped into negative territory as yields crept higher, driven by fading expectations of a December Fed rate cut following tough-talking Fed officials.
- The 2-Year Treasury yield dipped to 3.62%, but the 10-Year nudged up to 4.14%, extending duration pressures across the fixed-income landscape.
- Quality struggled, while corporate yields continued their climb: investment-grade corporate bonds moved to 4.90%, with high-yield pushing to 7.26%.
- High-yield spreads widened slightly as investors digested a softer macro backdrop and the potential for slower growth ahead.
Macroeconomic Data
- With the government still largely offline for much of the week, economic data was sparse; the NFIB Small Business Optimism Index slipped to 98.2, reflecting softer sales and declining profits.
- The shutdown—now officially the longest on record—ended Wednesday night, but uncertainty remains around key upcoming data releases. Some October reports may never be published.
- The Bureau of Labor Statistics announced that the September jobs report will finally be released on Thursday, November 20, giving markets something concrete to look forward to.
- Overseas, UK labor markets softened further, with the unemployment rate rising to 5%, its highest level since early 2021.

(as of Monday’s Market Opening)
| Total Return (1D) | Total Return (1W) | Total Return (MTD) | Total Return (QTD) | Total Return (YTD) | |
| S&P 500 | -0.05% | -1.44% | -1.55% | 0.68% | 14.49% |
| Dow Jones Industrial Average | -0.65% | -0.47% | -0.87% | 1.62% | 10.82% |
| NASDAQ | 0.13% | -2.66% | -3.47% | 1.06% | 18.59% |
| NASDAQ 100 | 0.58% | -1.85% | -2.78% | 1.86% | 19.64% |
| Russell 1000 | -0.04% | 0.08% | -1.56% | 0.66% | 15.09% |
| Russell 2000 | 0.29% | -1.71% | -3.55% | -1.85% | 8.32% |
| Russell 3000 | -0.04% | -0.07% | -1.69% | 0.42% | 14.72% |
| ACWI | -0.05% | 0.39% | -0.94% | 1.33% | 20.14% |
 Introducing the Spencer Stuart CEO Survey
As part of our ongoing commitment to bring you meaningful leadership and business-strategy insights, we want to introduce a powerful resource that many high-performing executives rely on but most business owners have never heard of: the Spencer Stuart CEO Survey.
What Is It?
Spencer Stuart is one of the world’s leading leadership advisory firms, best known for its work with CEOs and corporate boards. Each year, their Global Board & CEO Practice surveys more than a thousand CEOs and directors across industries to understand how top leaders are navigating change, setting priorities, and preparing their organizations for the future. The result is one of the most credible leadership pulse-checks available today.
Why It Matters for Business Owners
You don’t have to run a Fortune 500 company to benefit from the insights in this survey. Many of the strategic concerns CEOs highlight—talent, culture, communication, succession, and risk—are the same issues privately held companies face every day.
The survey provides business owners with:
- A leadership benchmark—how your priorities compare with global peers
- Practical insights into what drives long-term organizational health
- A forward look at emerging risks and opportunities in the marketplace
- Guidance on culture and talent, two areas consistently linked to performance
- Perspective on succession and transition planning, topics that matter greatly for closely held businesses
Key Themes from Recent Reports
Spencer Stuart’s most recent findings highlight several trends worth noting:
- Uncertainty remains high, and the strongest leaders focus on controllable factors such as culture, clarity, and internal alignment.
- Talent and culture continue to rank among the top CEO priorities—often above technology or economic pressures.
- There is frequently a gap in perception between CEOs and boards, underscoring the need for clear communication and shared expectations.
- Succession readiness is a persistent challenge, even among larger organizations with deeper leadership benches.
How We Use This Resource for You
We integrate these leadership insights into the business-owner side of our Wealth Mechanics™ framework—especially in the areas of strategy, organizational readiness, and succession planning.
Our goal is simple: To help you strengthen the leadership, culture, and structure of your business so it can thrive today and transition smoothly in the future. We’ll continue sharing key findings from the Spencer Stuart survey throughout the year and translating them into practical actions for business owners.
SOURCE: Bloomberg
Global Client Survey
We’re inviting you to take part in a quick, anonymous client survey. Your feedback helps us fine-tune our process, elevate your experience, and ensure we’re delivering what matters most to you. This isn’t just about checking a box—it’s about shaping the future of how we serve you. Your voice helps guide our next steps. We’re listening. We’re learning. And we’re grateful for your trust.
Take Our Survey Now (click here)
Disclosures
- Wealth Mechanics™ is a registered trademark of Cestia Wealth Management. Unauthorized use of the trademark, including but not limited to commercial use, reproduction, or imitation without explicit written permission from Cestia Wealth Management, is strictly prohibited.
- Market commentary provided by NewEdge Advisors
- Charts concerning market data are provided by Exhibit A.
- Guides and other downloadable firm material respective to financial planning processes and data are provided and powered by fpPathfinder.
- Advisory services offered through NewEdge Advisors, LLC, a registered investment adviser. Securities offered through NewEdge Securities, LLC. Member FINRA/SIPC. NewEdge Advisors, LLC and NewEdge Securities, LLC are wholly owned subsidiaries of NewEdge Capital Group, LLC.
- Cestia Wealth Management is not a legal tax professional. We offer tax gap analysis for clients who desire to have a comprehensive financial plan, which requires in-depth tax strategy and planning as a distinct part of the overall customized solution. Please consult your tax professional on all matters addressed in this report.
- Information about annuities are not to be considered a recommendation. The information provided should not considered a recommendation to purchase or sell any particular security.
- Investing involves risk, including the potential loss of principal. No investment strategy can guarantee a profit or protect against loss in periods of declining values. Past performance is no guarantee of future results. Please note that individual situations can vary. Therefore, the information presented here should only be relied upon when coordinated with individual professional advice.
