



November 7, 2025
WEEKLY TOUCHPOINT
Market Resilience in 2025
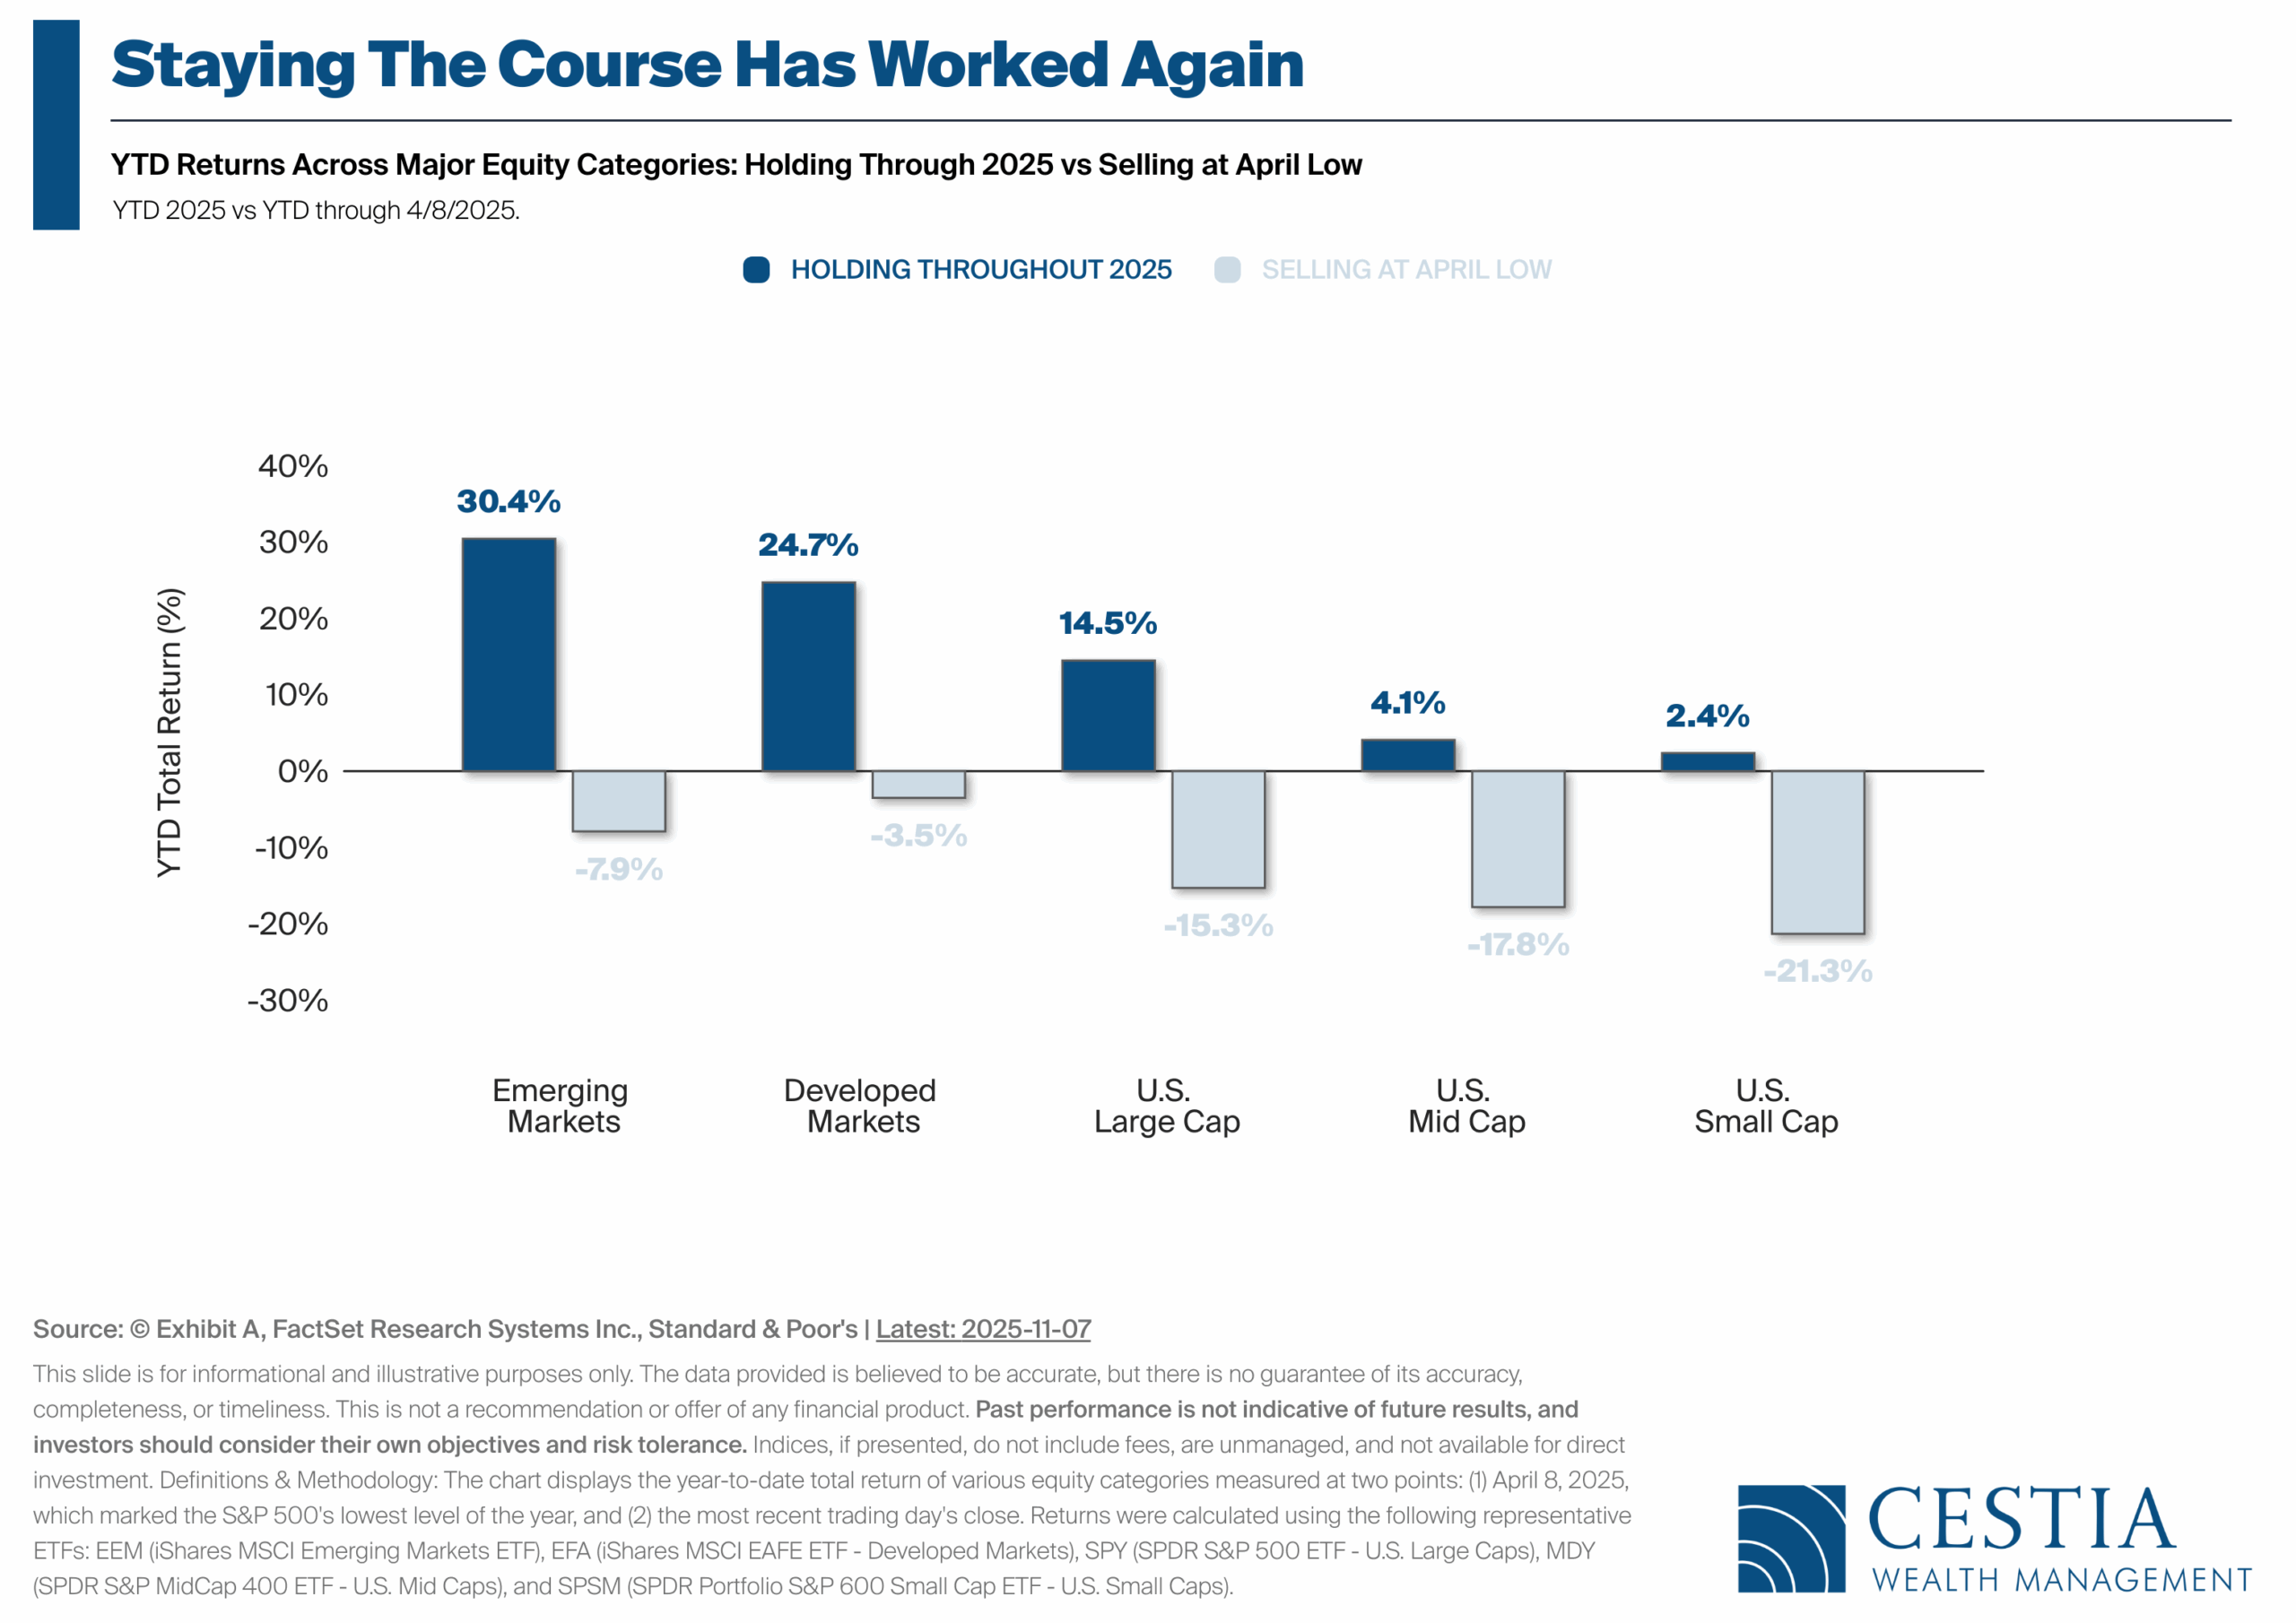
This week’s chart highlights the power of patience. Investors who held their ground through April’s market panic have seen strong year-to-date gains across every major equity category. Those who sold amid the noise, however, locked in losses just before the rebound. The data offers a clear reminder: staying invested through turbulence often proves to be the strongest defense against short-term fear.

Rough Week Erases Most of Crypto’s 2025 Gains
Government shutdown could be headed for end
Warren Buffett’s Letter Comes Monday. Why It’s a Must-Read.
Small Business Optimism Declines in September

Revisiting the 4% Rule: Bill Bengen’s New Insights
Bill Bengen, the financial planner known as the father of the 4% rule, has released a new book — A Richer Retirement: Supercharging the 4% Rule — updating his landmark research on sustainable retirement withdrawals.
What Is the 4% Rule?
The 4% rule is a guideline for drawing income from your portfolio in retirement. It suggests that you can withdraw 4% of your initial portfolio value in your first year of retirement and increase that amount each year to keep pace with inflation—helping maintain stable purchasing power for roughly 30 years.
- Example: A $1,000,000 portfolio → $40,000 withdrawal in year one.
- If inflation is 3%, year two would increase to $41,200.
This approach avoids tying withdrawals directly to market swings, helping retirees maintain predictable income even when markets fluctuate.
Bengen’s Latest Findings
In his new analysis—updating data back to 1926—Bengen refined what he calls the “safe max” withdrawal rate:
- 4.7% — historically never failed (an increase from the original 4.15%)
- 6% — about a 75% success rate
- 7% — roughly 50% success rate
The lowest historical success occurred for retirees starting in October 1968, a period marked by high inflation and weak markets.
The Role of Asset Allocation
Bengen’s research—and every major study since—shows that withdrawal success depends heavily on asset allocation.
- Portfolios holding a balanced mix of stocks and bonds (typically 50–75% equities) have historically produced the most durable outcomes.
- Too conservative, and inflation erodes purchasing power over time.
- Too aggressive, and market downturns early in retirement can cause lasting damage (“sequence-of-returns risk”).
A sustainable plan isn’t just about the percentage you withdraw—it’s about aligning that rate with your investment mix, time horizon, and comfort with market volatility. In short: The right asset allocation is the engine that makes the 4% rule work.

Equities
- Stocks stumbled as concerns about stretched valuations and runaway AI spending fueled a sharp pullback.
- The prolonged U.S. government shutdown—the longest on record—added uncertainty, curbing confidence and economic visibility.
- A private jobs report showed 1.1 million job cuts year-to-date, a 65% increase from last year, reinforcing fears of a cooling labor market.
- Growth stocks bore the brunt, with the Russell 1000 Growth underperforming value by the widest margin since February.
- Defensive sectors—energy, utilities, materials, staples, and real estate—found relative strength as investors sought stability and yield.
Bonds
- Treasury yields diverged: 2-year yield slipped to 3.56%, while the 10-year nudged higher to 4.10%.
- Investors weighed softer labor data against talk of rolling back certain Trump-era tariffs.
- Longer-duration bonds lagged, but higher-quality debt held its ground.
- Investment-grade corporates advanced to 4.85%, while high-yield bonds rose to 7.25% as risk appetite faded.
- A classic “flight to quality” tone set in as equity volatility picked up.
Macroeconomic Data
- Despite the data blackout from the shutdown, several key indicators offered clues on momentum.
- The ISM Manufacturing Index slid again to 48.7%, its eighth straight month of contraction amid tariff-related cost pressures.
- Private payrolls rebounded modestly, with 42,000 new jobs, the first gain in three months.
- The ISM Services Index climbed to 51.4, its fastest growth in eight months—a rare bright spot.
- Consumer sentiment weakened sharply, with the University of Michigan index falling to 50.3, near post-pandemic lows, as households grew more pessimistic about finances and business conditions.

(as of Monday’s Market Opening)
| Total Return (1D) | Total Return (1W) | Total Return (MTD) | Total Return (QTD) | Total Return (YTD) | |
| S&P 500 | 0.83% | -0.99% | -0.82% | 1.44% | 15.35% |
| Dow Jones Industrial Average | 0.10% | -0.64% | -1.11% | 1.37% | 10.56% |
| NASDAQ | 1.41% | -2.12% | -1.67% | 2.95% | 20.80% |
| NASDAQ 100 | 1.43% | -2.13% | -1.70% | 2.99% | 20.97% |
| Russell 1000 | 1.17% | -0.58% | -0.48% | 1.76% | 16.35% |
| Russell 2000 | 0.92% | -0.65% | -0.97% | 0.78% | 11.22% |
| Russell 3000 | 0.70% | -1.06% | -0.93% | 1.20% | 15.61% |
| ACWI | 1.08% | -0.47% | -0.25% | 2.03% | 20.97% |

Every business owner has hidden gaps—in profit, value, and personal wealth. Knowing where they are is the first step to closing them.
Know Your Gaps
Most business owners think of “value” as what the company is worth on paper. But the real story is written in three numbers every owner should know:
- The Profit Gap: The profit you’re leaving on the table by not operating at a best-in-class level.
- Formula: Best-in-Class Profit – Your Actual Profit
- For many owners, this starts with a recasted EBITDA—adjusted for one-time events, discretionary expenses, and out-of-market costs like above-market rent or compensation. A strong Profit Gap analysis shows exactly what operational excellence could be worth in real dollars.
- The Value Gap: The business value you’re sacrificing by not achieving best-in-class performance.
- Formula: Best-in-Class Value – Your Actual Business Value
- A buyer’s lens matters. The difference between what your company is worth today and what it could be worth with stronger systems, management depth, and predictable cash flow is often life-changing. In exit planning, that gap represents your untapped wealth.
- The Wealth Gap: The additional wealth you need to meet your life goals.
- Formula: Net Worth Goal – Current Net Worth (excluding business)
- Your business may be your biggest asset, but it’s not liquid—nor guaranteed to be converted to cash. Identifying your Wealth Gap helps you focus on the personal side of the equation: how much you’ll need to live your next act comfortably and on your terms.
Why This Matters
From Walking to Destiny and the CEPA curriculum, we know that value growth is intentional. When you narrow your Profit Gap, you automatically shrink your Value Gap, and when you close both, you’re on your way to bridging your Wealth Gap.
Owners who consistently measure these three metrics are more likely to:
- Build transferable enterprise value
- Strengthen cash flow and culture simultaneously
- Be ready to sell—or stay—instead of being forced to react
In the words of Chris Snider, “With readiness comes success, freedom, and wealth.”
Takeaway for Business Owners
Ask yourself: What could I do in my business with that extra profit flow? How quickly could narrowing my Value Gap close my Wealth Gap? What would life look like if I ran my company as if it were for sale—every day?
SOURCE: The Exit Planning Institute
Global Client Survey
We’re inviting you to take part in a quick, anonymous client survey. Your feedback helps us fine-tune our process, elevate your experience, and ensure we’re delivering what matters most to you. This isn’t just about checking a box—it’s about shaping the future of how we serve you. Your voice helps guide our next steps. We’re listening. We’re learning. And we’re grateful for your trust.
Take Our Survey Now (click here)
Disclosures
- Wealth Mechanics™ is a registered trademark of Cestia Wealth Management. Unauthorized use of the trademark, including but not limited to commercial use, reproduction, or imitation without explicit written permission from Cestia Wealth Management, is strictly prohibited.
- Market commentary provided by NewEdge Advisors
- Charts concerning market data are provided by Exhibit A.
- Guides and other downloadable firm material respective to financial planning processes and data are provided and powered by fpPathfinder.
- Advisory services offered through NewEdge Advisors, LLC, a registered investment adviser. Securities offered through NewEdge Securities, LLC. Member FINRA/SIPC. NewEdge Advisors, LLC and NewEdge Securities, LLC are wholly owned subsidiaries of NewEdge Capital Group, LLC.
- Cestia Wealth Management is not a legal tax professional. We offer tax gap analysis for clients who desire to have a comprehensive financial plan, which requires in-depth tax strategy and planning as a distinct part of the overall customized solution. Please consult your tax professional on all matters addressed in this report.
- Information about annuities are not to be considered a recommendation. The information provided should not considered a recommendation to purchase or sell any particular security.
- Investing involves risk, including the potential loss of principal. No investment strategy can guarantee a profit or protect against loss in periods of declining values. Past performance is no guarantee of future results. Please note that individual situations can vary. Therefore, the information presented here should only be relied upon when coordinated with individual professional advice.
