



Week Ending December 12, 2025
WEEKLY TOUCHPOINT
A Reminder of What Diversification Really Looks Like
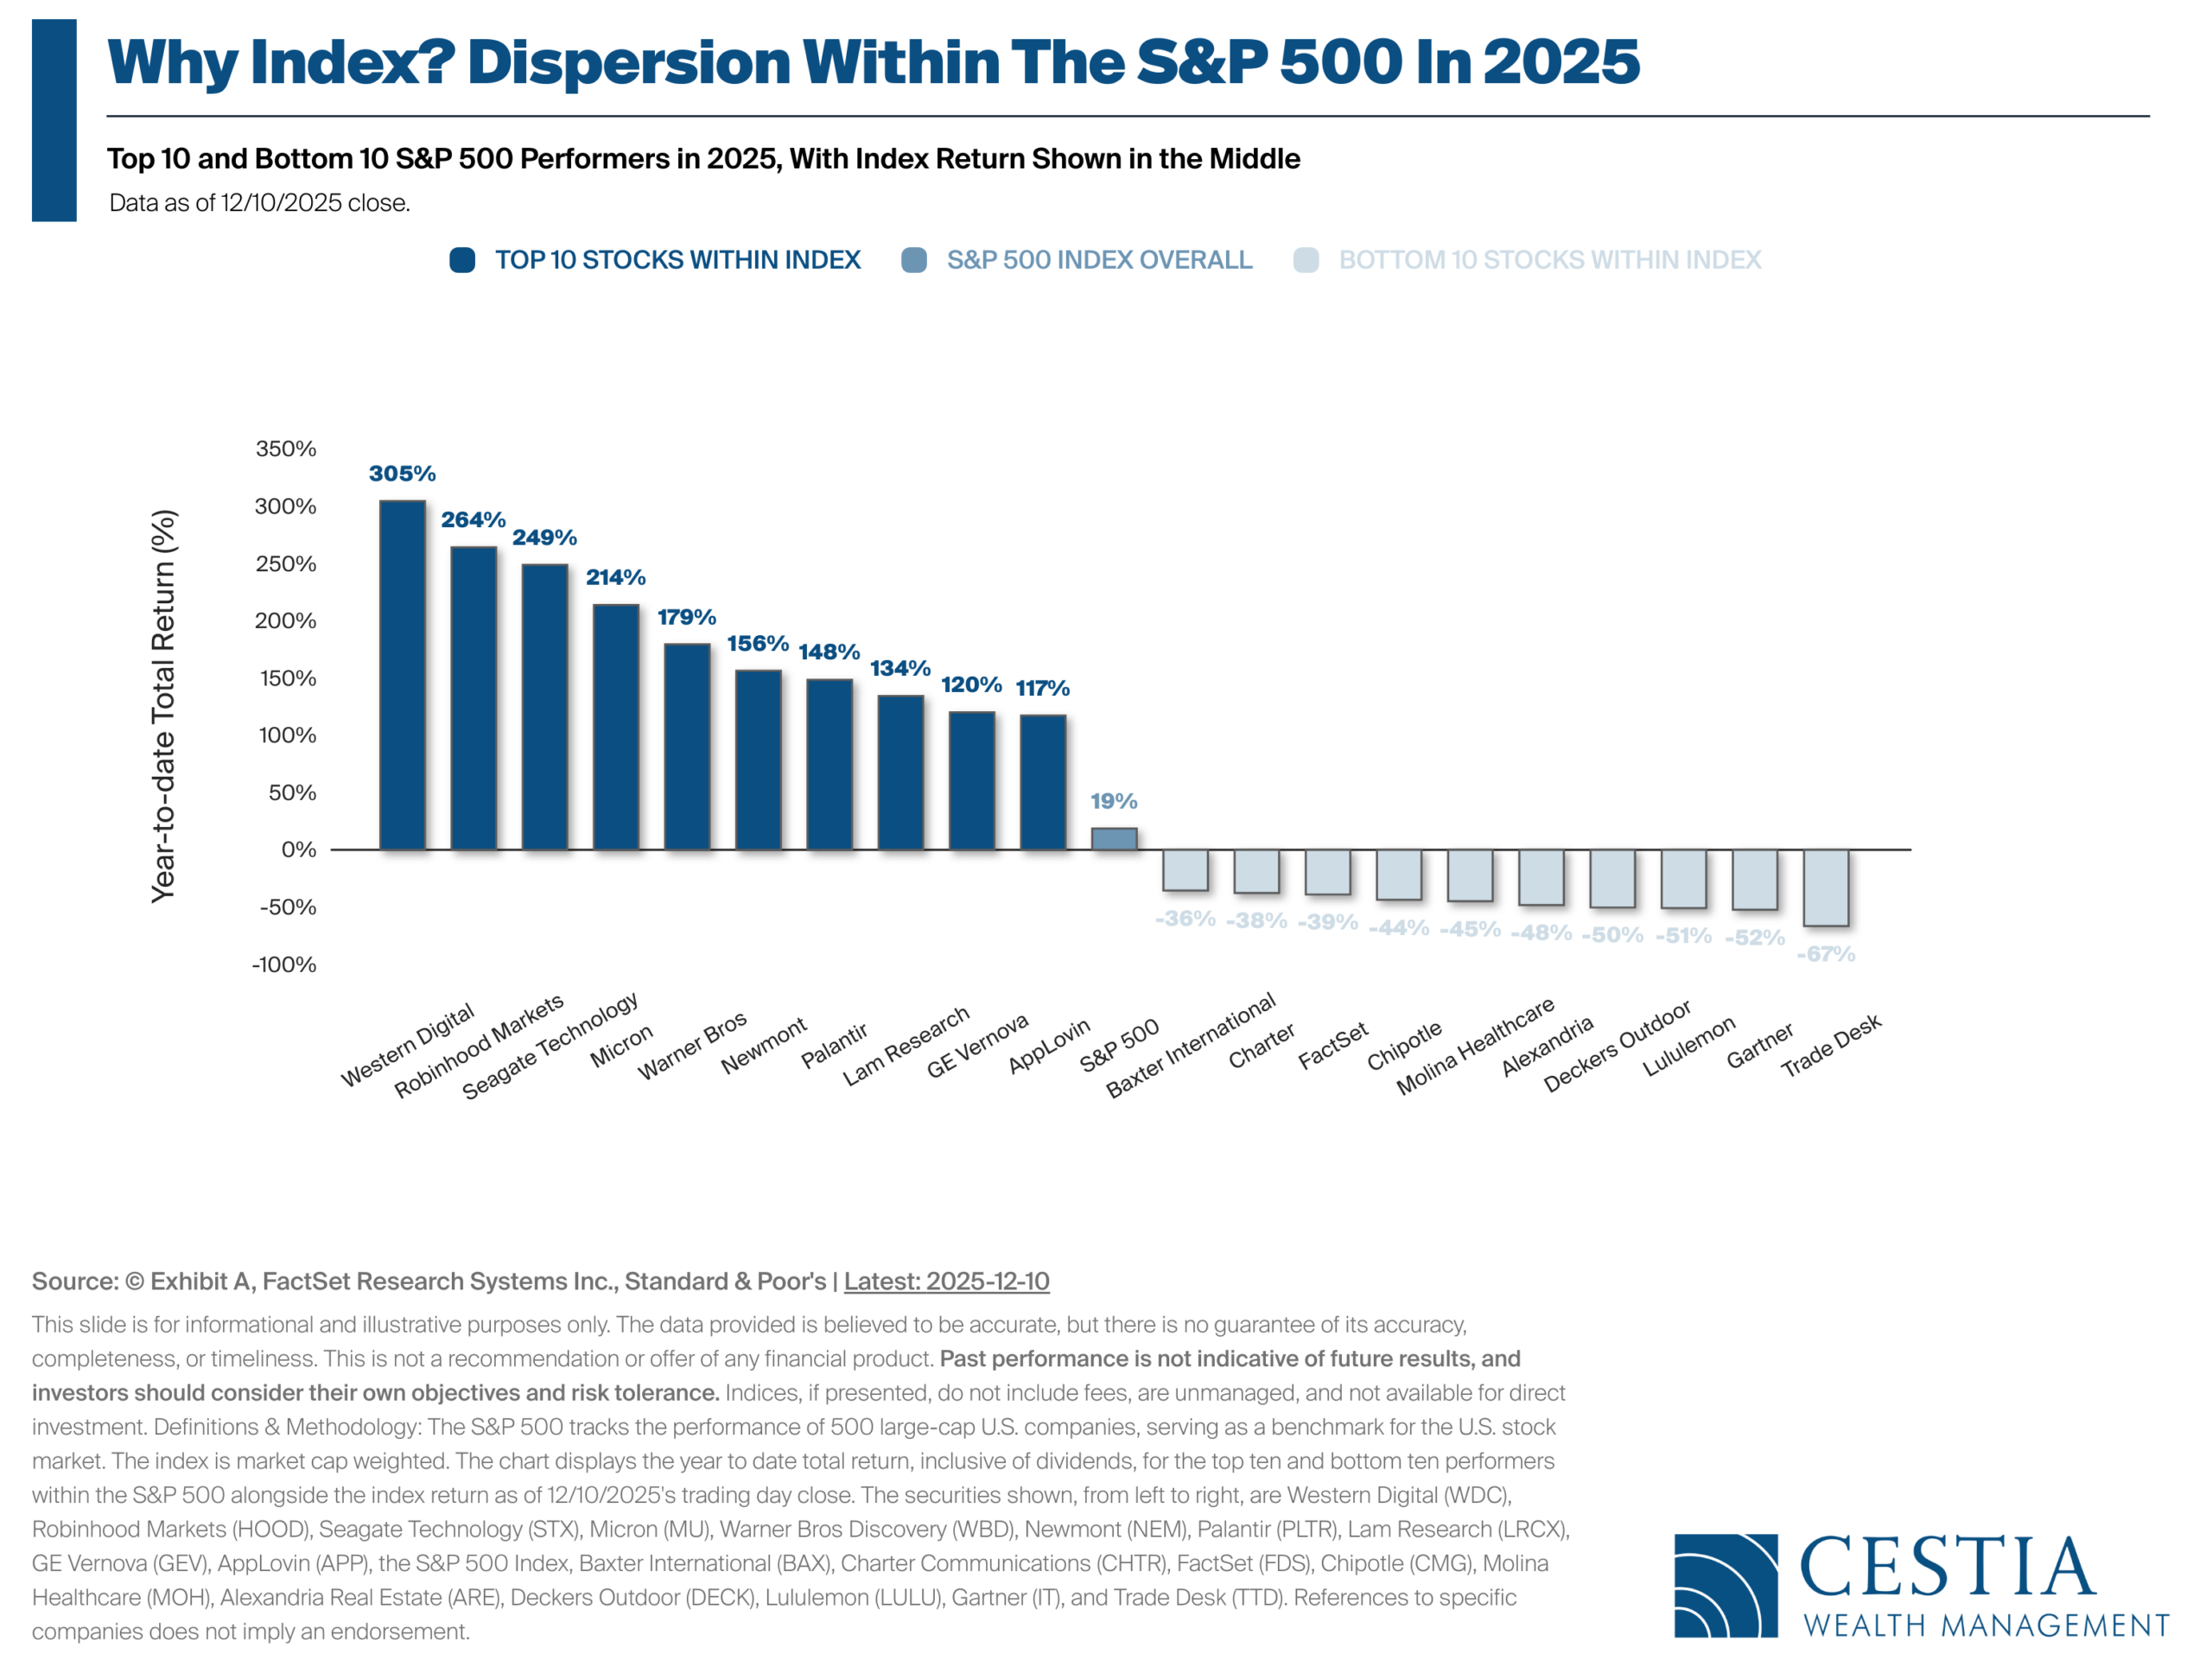
This chart tells an important story about what’s happening beneath the surface of the S&P 500. While the index itself posts a clean year-to-date return, the experience of individual stocks inside the index has been anything but uniform. Some companies are delivering eye-catching gains, while others are quietly lagging or even moving backward.
Why This Matters
When investors see standout winners, our brains naturally gravitate toward them — a mix of recency bias (“it’s been working”) and fear of missing out (“everyone else is making money”). The problem is that by the time a stock becomes obvious, much of the upside is often already priced in. Chasing recent winners can lead investors to buy high, abandon discipline, and increase portfolio risk at exactly the wrong moment.
The index return, sitting between the best and worst performers, reminds us that long-term results come from participating in the entire distribution, not from perfectly timing the next star performer. Broad diversification helps counter these behavioral traps by keeping emotion from driving decisions — allowing investors to stay invested, stay patient, and stay aligned with their long-term plan.

How baby boomers got so rich, and why their kids are unlikely to catch up

What’s Changing with Social Security & Medicare in 2026?
As we look ahead to 2026, both Social Security and Medicare are making a few important adjustments. These changes happen every year, but understanding them early can help you plan with confidence. Here’s what to expect:
Social Security: A Modest Boost for 2026
- Benefits will increase by 2.8%, thanks to the annual cost-of-living adjustment (COLA).
- This adjustment is meant to help retirees keep pace with inflation—though it’s smaller than the bumps seen in recent high-inflation years.
- Delaying benefits still pays off: waiting past full retirement age can increase your benefit by about 8% per year until age 70.
- Be mindful of how other income sources (work, pensions, investments) may impact the taxes on your benefits.
- Smart income planning can help keep more of your monthly check in your pocket.
Medicare: Higher Costs to Keep in Mind
- The Medicare Part B premium is rising from $185 (2025) to about $202.90 per month for 2026.
- The Part B deductible is also increasing, meaning you’ll pay a bit more out of pocket before coverage starts.
- These rising costs may offset some of your Social Security COLA increase, since premiums are deducted directly from your monthly benefit.
- Income matters: Medicare looks back at your tax return from two years ago to determine whether you’ll pay higher premiums (IRMAA).
- This makes tax-smart retirement income planning more important than ever.
What This Means for You
- Expect a small benefit increase—and slightly higher healthcare costs.
- Retirees already receiving Social Security will see these changes reflected automatically in January checks.
- For those approaching retirement, timing Social Security benefits and managing taxable income can meaningfully impact your long-term retirement strategy.
- We continue to monitor these annual updates to help you navigate decisions with clarity and control.
Our Perspective
These yearly adjustments are reminders that retirement planning is not “set it and forget it.” Social Security, Medicare, taxes, and income all intersect—and when managed together, they can unlock more comfort, more confidence, and more long-term financial resilience. If you have questions about how these changes may affect your personal retirement income strategy, we’re here to help you navigate each step thoughtfully and proactively.
SOURCE: advisor perspectives

Equities
- A quick peek above the clouds—then back down: Major indexes briefly touched all-time highs after the Fed meeting, but Friday’s pullback left the S&P 500 modestly lower for the week.
- Leadership shifted under the surface: Mid- and small-cap stocks held onto their midweek gains, quietly outperforming large-cap peers.
- Value had its moment: Value stocks outpaced growth, narrowing the year-to-date gap as investors grew more selective.
- Tech felt the pressure: Renewed AI spending concerns weighed on Information Technology and Communication Services, with Oracle’s earnings reviving questions about rising capital expenditures.
- Global markets kept marching: Developed and emerging international equities continued to advance, supported by improving global sentiment.
Bonds
- A familiar tug-of-war: Falling short-term yields and rising long-term yields pushed bond prices lower overall.
- Yield curve steepened: The 2-year Treasury fell to 3.52% while the 10-year climbed to 4.19%, widening the 2-10 spread to 0.67%.
- Duration still matters: Short and intermediate bonds were relatively stable, but longer-duration bonds added to December’s losses.
- Credit spreads remain tight: Government bonds narrowly outperformed corporates and high yield, even as spreads stayed historically compressed.
- Income levels moved higher: Investment-grade yields ended at 4.88%, while high-yield finished near 7.14%.
Macroeconomic Data
- Fed delivered the expected cut: The FOMC lowered rates by 0.25% to a 3.5%–3.75% range—but three dissenting votes underscored growing uncertainty.
- Mixed signals from Powell: The Fed acknowledged rising downside risks to employment, while inflation risks—especially tariff-related—remain on the radar.
- Labor market cooling, not cracking: Job openings held steady near 7.67M, but declining quits suggest workers are growing more cautious.
- Claims sent mixed messages: Initial jobless claims rose to 236K, while continuing claims declined more than expected.
- Bottom line: Policy clarity remains elusive, reinforcing why markets are reacting more to directional hints than hard data.

(as of Monday’s Market Opening)
| Total Return (1D) | Total Return (1W) | Total Return (MTD) | Total Return (QTD) | Total Return (YTD) | |
| S&P 500 | 0.37% | 0.09% | 0.05% | 2.46% | 16.51% |
| Dow Jones Industrial Average | 0.26% | 1.77% | 1.82% | 4.71% | 14.19% |
| NASDAQ | -0.02% | -1.51% | -0.75% | 2.34% | 20.09% |
| NASDAQ 100 | 0.42% | -1.27% | -0.52% | 2.52% | 20.42% |
| Russell 1000 | 0.11% | -0.11% | -0.07% | 2.38% | 17.06% |
| Russell 2000 | -0.29% | 0.89% | 1.75% | 4.61% | 15.45% |
| Russell 3000 | 0.07% | -0.07% | -0.06% | 2.37% | 16.95% |
| ACWI | 0.33% | 0.33% | 0.54% | 2.89% | 21.98% |

Retirement Satisfaction Predictor
The following predictive model was designed specifically to help business owners determine if they are psychologically prepared to exit their businesses and transition into a new stage of life. The following thirty-six questions that follow will gauge your attitudes, beliefs, and values with regarding transitioning out of a business or retiring. These questions are based on research performed by a wide variety of experts in the field of entrepreneurship, aging and retirement.
Understanding how you feel about retirement on both a conscious and subconscious level is important before you make any important plans about exiting or retiring from your business. The Exit Planning Institute has worked with hundreds of business owners who were beginning to think about their retirement. Based on that experience and our independent research we have distilled their attitudes about retirement into six categories or groups:
- Perspectives about Work and Retirement
- Financial Preparation for Retirement
- Expectations about Retirement
- Friends, Family & Community
- Health Concerns
- Involvement during Retirement
The pre-retirement attitudes of business owners on these issues were then correlated with their subsequent satisfaction with retirement. The results of that research were then built into a model that can help other business owners predict their probable satisfaction with retirement
Retirement Satisfaction Predictor
Global Client Survey
We’re inviting you to take part in a quick, anonymous client survey. Your feedback helps us fine-tune our process, elevate your experience, and ensure we’re delivering what matters most to you. This isn’t just about checking a box—it’s about shaping the future of how we serve you. Your voice helps guide our next steps. We’re listening. We’re learning. And we’re grateful for your trust.
Take Our Survey Now (click here)
Disclosures
- Wealth Mechanics™ is a registered trademark of Cestia Wealth Management. Unauthorized use of the trademark, including but not limited to commercial use, reproduction, or imitation without explicit written permission from Cestia Wealth Management, is strictly prohibited.
- Market commentary provided by NewEdge Advisors
- Charts concerning market data are provided by Exhibit A.
- Guides and other downloadable firm material respective to financial planning processes and data are provided and powered by fpPathfinder.
- Advisory services offered through NewEdge Advisors, LLC, a registered investment adviser. Securities offered through NewEdge Securities, LLC. Member FINRA/SIPC. NewEdge Advisors, LLC and NewEdge Securities, LLC are wholly owned subsidiaries of NewEdge Capital Group, LLC.
- Cestia Wealth Management is not a legal tax professional. We offer tax gap analysis for clients who desire to have a comprehensive financial plan, which requires in-depth tax strategy and planning as a distinct part of the overall customized solution. Please consult your tax professional on all matters addressed in this report.
- Information about annuities are not to be considered a recommendation. The information provided should not considered a recommendation to purchase or sell any particular security.
- Investing involves risk, including the potential loss of principal. No investment strategy can guarantee a profit or protect against loss in periods of declining values. Past performance is no guarantee of future results. Please note that individual situations can vary. Therefore, the information presented here should only be relied upon when coordinated with individual professional advice.
