



Week Ending March 6, 2026
WEEKLY TOUCHPOINT
Diversification at Work
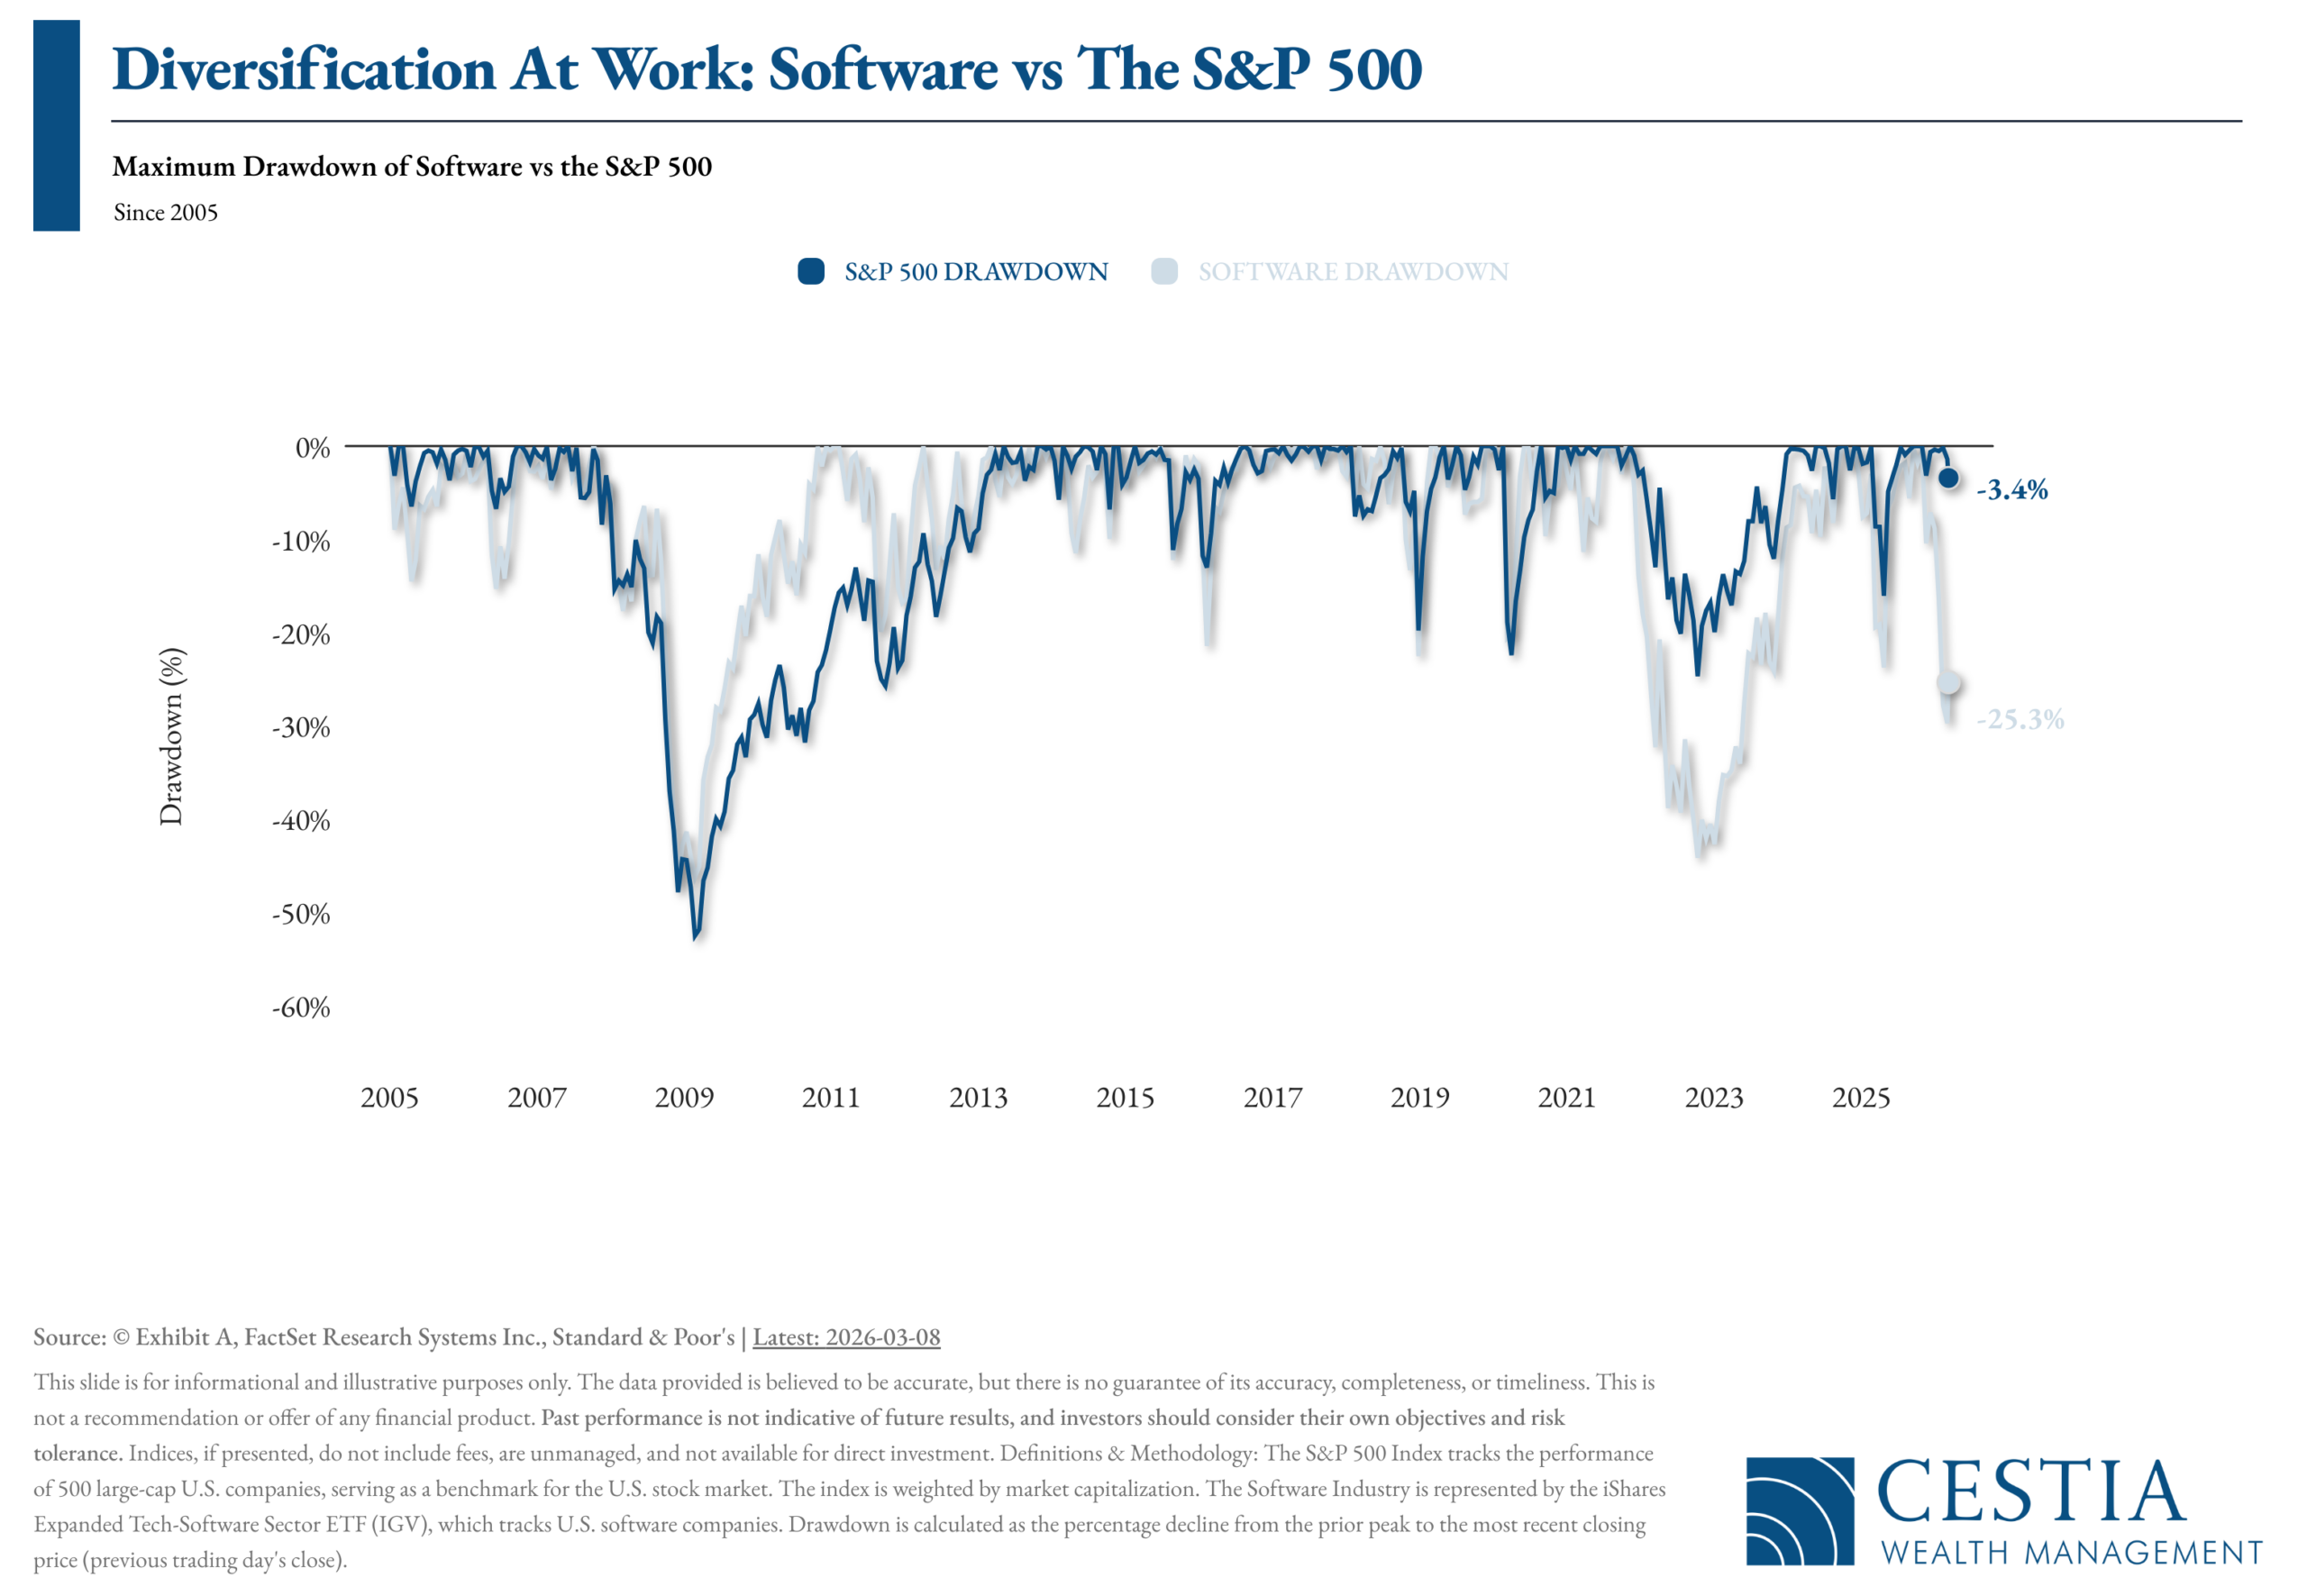
The technology sector often captures investors’ attention during periods of rapid growth, but recent data reminds us how concentrated bets can amplify volatility. As of March 8, 2026, the software industry has experienced a drawdown of about -25.3%, compared to just -3.4% for the broader S&P 500 Index. The difference highlights an important principle of long-term investing: diversification. While sector-specific investments can deliver strong upside during favorable cycles, broader market exposure spreads risk across multiple industries and can help smooth the ride when one segment of the market faces a deeper pullback.

Iran War Turns Middle Eastern Tourist Hot Spots into Strike Zones
Analyst Outlines 2 Potential Scenarios for Conflict
Apple’s Product Revamp Shows Fruit of AI Comeback Strategy

What Issues Should I Consider When Harvesting Capital Losses?
Tax-loss harvesting is a popular strategy, but it’s not always clear whether it’s the right strategy for your client’s needs.
With this checklist, you will be better prepared to help your clients determine whether harvesting capital losses is appropriate for their financial situation.
This checklist covers some key issues to consider when a client and/or advisor are thinking of implementing a tax-loss harvesting strategy, such as:
- The effect harvesting losses may have on your overall portfolio goals.
- Some common pitfalls and rules to be aware of when harvesting losses.
- The potential tax benefits and consequences that may arise.
- How long-term goals may be affected by tax-loss harvesting.
SOURCE: fpPathfinder

Equities
- Markets declined as tensions in the Middle East escalated and the Strait of Hormuz closed, sending oil prices sharply higher and weighing on global equities.
- Growth stocks outperformed value, narrowing their year-to-date performance gap.
- Small-cap stocks were hit hardest, reflecting their sensitivity to rising interest rates and higher energy costs.
- Energy was the only positive sector in the S&P 500, while materials fell sharply due to rising petroleum-based input costs.
- International equities lagged U.S. markets, largely because of their heavier dependence on Middle Eastern energy supplies.
Bonds
- Bond markets declined as interest rates moved higher from recent lows.
- Long-duration bonds underperformed, with long-term yields rising faster than short-term rates.
- The 10-year Treasury yield rose to 4.15%, while the 2-year reached 3.56%, leaving the yield curve slope mostly unchanged.
- Investment-grade corporate yields climbed to 4.91%, reflecting tighter financial conditions.
- High-yield bond yields increased to 7.30%, indicating slightly higher perceived credit risk.
Macroeconomic Data
- Labor market data surprised to the downside as the BLS reported a loss of 92,000 jobs in February, reversing ADP’s earlier gain estimate.
- The weaker report may have been influenced by healthcare strikes and Winter Storm Fern disruptions.
- Despite the decline in jobs, the unemployment rate remained relatively stable at 4.4%.
- Retail sales fell 0.2% in January, driven by weaker auto and gasoline purchases.
- The ISM Manufacturing PMI rose to 52.4, marking a second month of expansion, though businesses cited concerns over metal prices and tariffs.

(as of Monday’s Market Opening)
| Total Return (1D) | Total Return (1W) | Total Return (MTD) | Total Return (QTD) | Total Return (YTD) | |
| S&P 500 | -0.53% | -2.57% | -2.54% | -2.06% | -2.06% |
| Dow Jones Industrial Average | -0.91% | -3.75% | -3.89% | -2.06% | -2.06% |
| NASDAQ | -0.21% | -1.80% | -1.45% | -3.88% | -3.88% |
| NASDAQ 100 | -0.16% | -1.56% | -1.43% | -2.56% | -2.56% |
| Russell 1000 | -0.55% | -2.59% | -2.59% | -1.85% | -1.85% |
| Russell 2000 | -0.99% | -4.97% | -4.97% | 0.92% | 0.92% |
| Russell 3000 | -0.58% | -2.69% | -2.69% | -1.73% | -1.73% |
| ACWI | -0.55% | -4.39% | -4.39% | -0.41% | -0.41% |
Disclosures
- Wealth Mechanics™ is a registered trademark of Cestia Wealth Management. Unauthorized use of the trademark, including but not limited to commercial use, reproduction, or imitation without explicit written permission from Cestia Wealth Management, is strictly prohibited.
- Market commentary provided by NewEdge Advisors
- Charts concerning market data are provided by Exhibit A.
- Guides and other downloadable firm material respective to financial planning processes and data are provided and powered by fpPathfinder.
- Advisory services offered through NewEdge Advisors, LLC, a registered investment adviser. Securities offered through NewEdge Securities, LLC. Member FINRA/SIPC. NewEdge Advisors, LLC and NewEdge Securities, LLC are wholly owned subsidiaries of NewEdge Capital Group, LLC.
- Cestia Wealth Management is not a legal tax professional. We offer tax gap analysis for clients who desire to have a comprehensive financial plan, which requires in-depth tax strategy and planning as a distinct part of the overall customized solution. Please consult your tax professional on all matters addressed in this report.
- Information about annuities are not to be considered a recommendation. The information provided should not considered a recommendation to purchase or sell any particular security.
- Investing involves risk, including the potential loss of principal. No investment strategy can guarantee a profit or protect against loss in periods of declining values. Past performance is no guarantee of future results. Please note that individual situations can vary. Therefore, the information presented here should only be relied upon when coordinated with individual professional advice.
