



Week Ending March 13, 2026
WEEKLY TOUCHPOINT
What Big Oil Swings Have Meant for Stocks
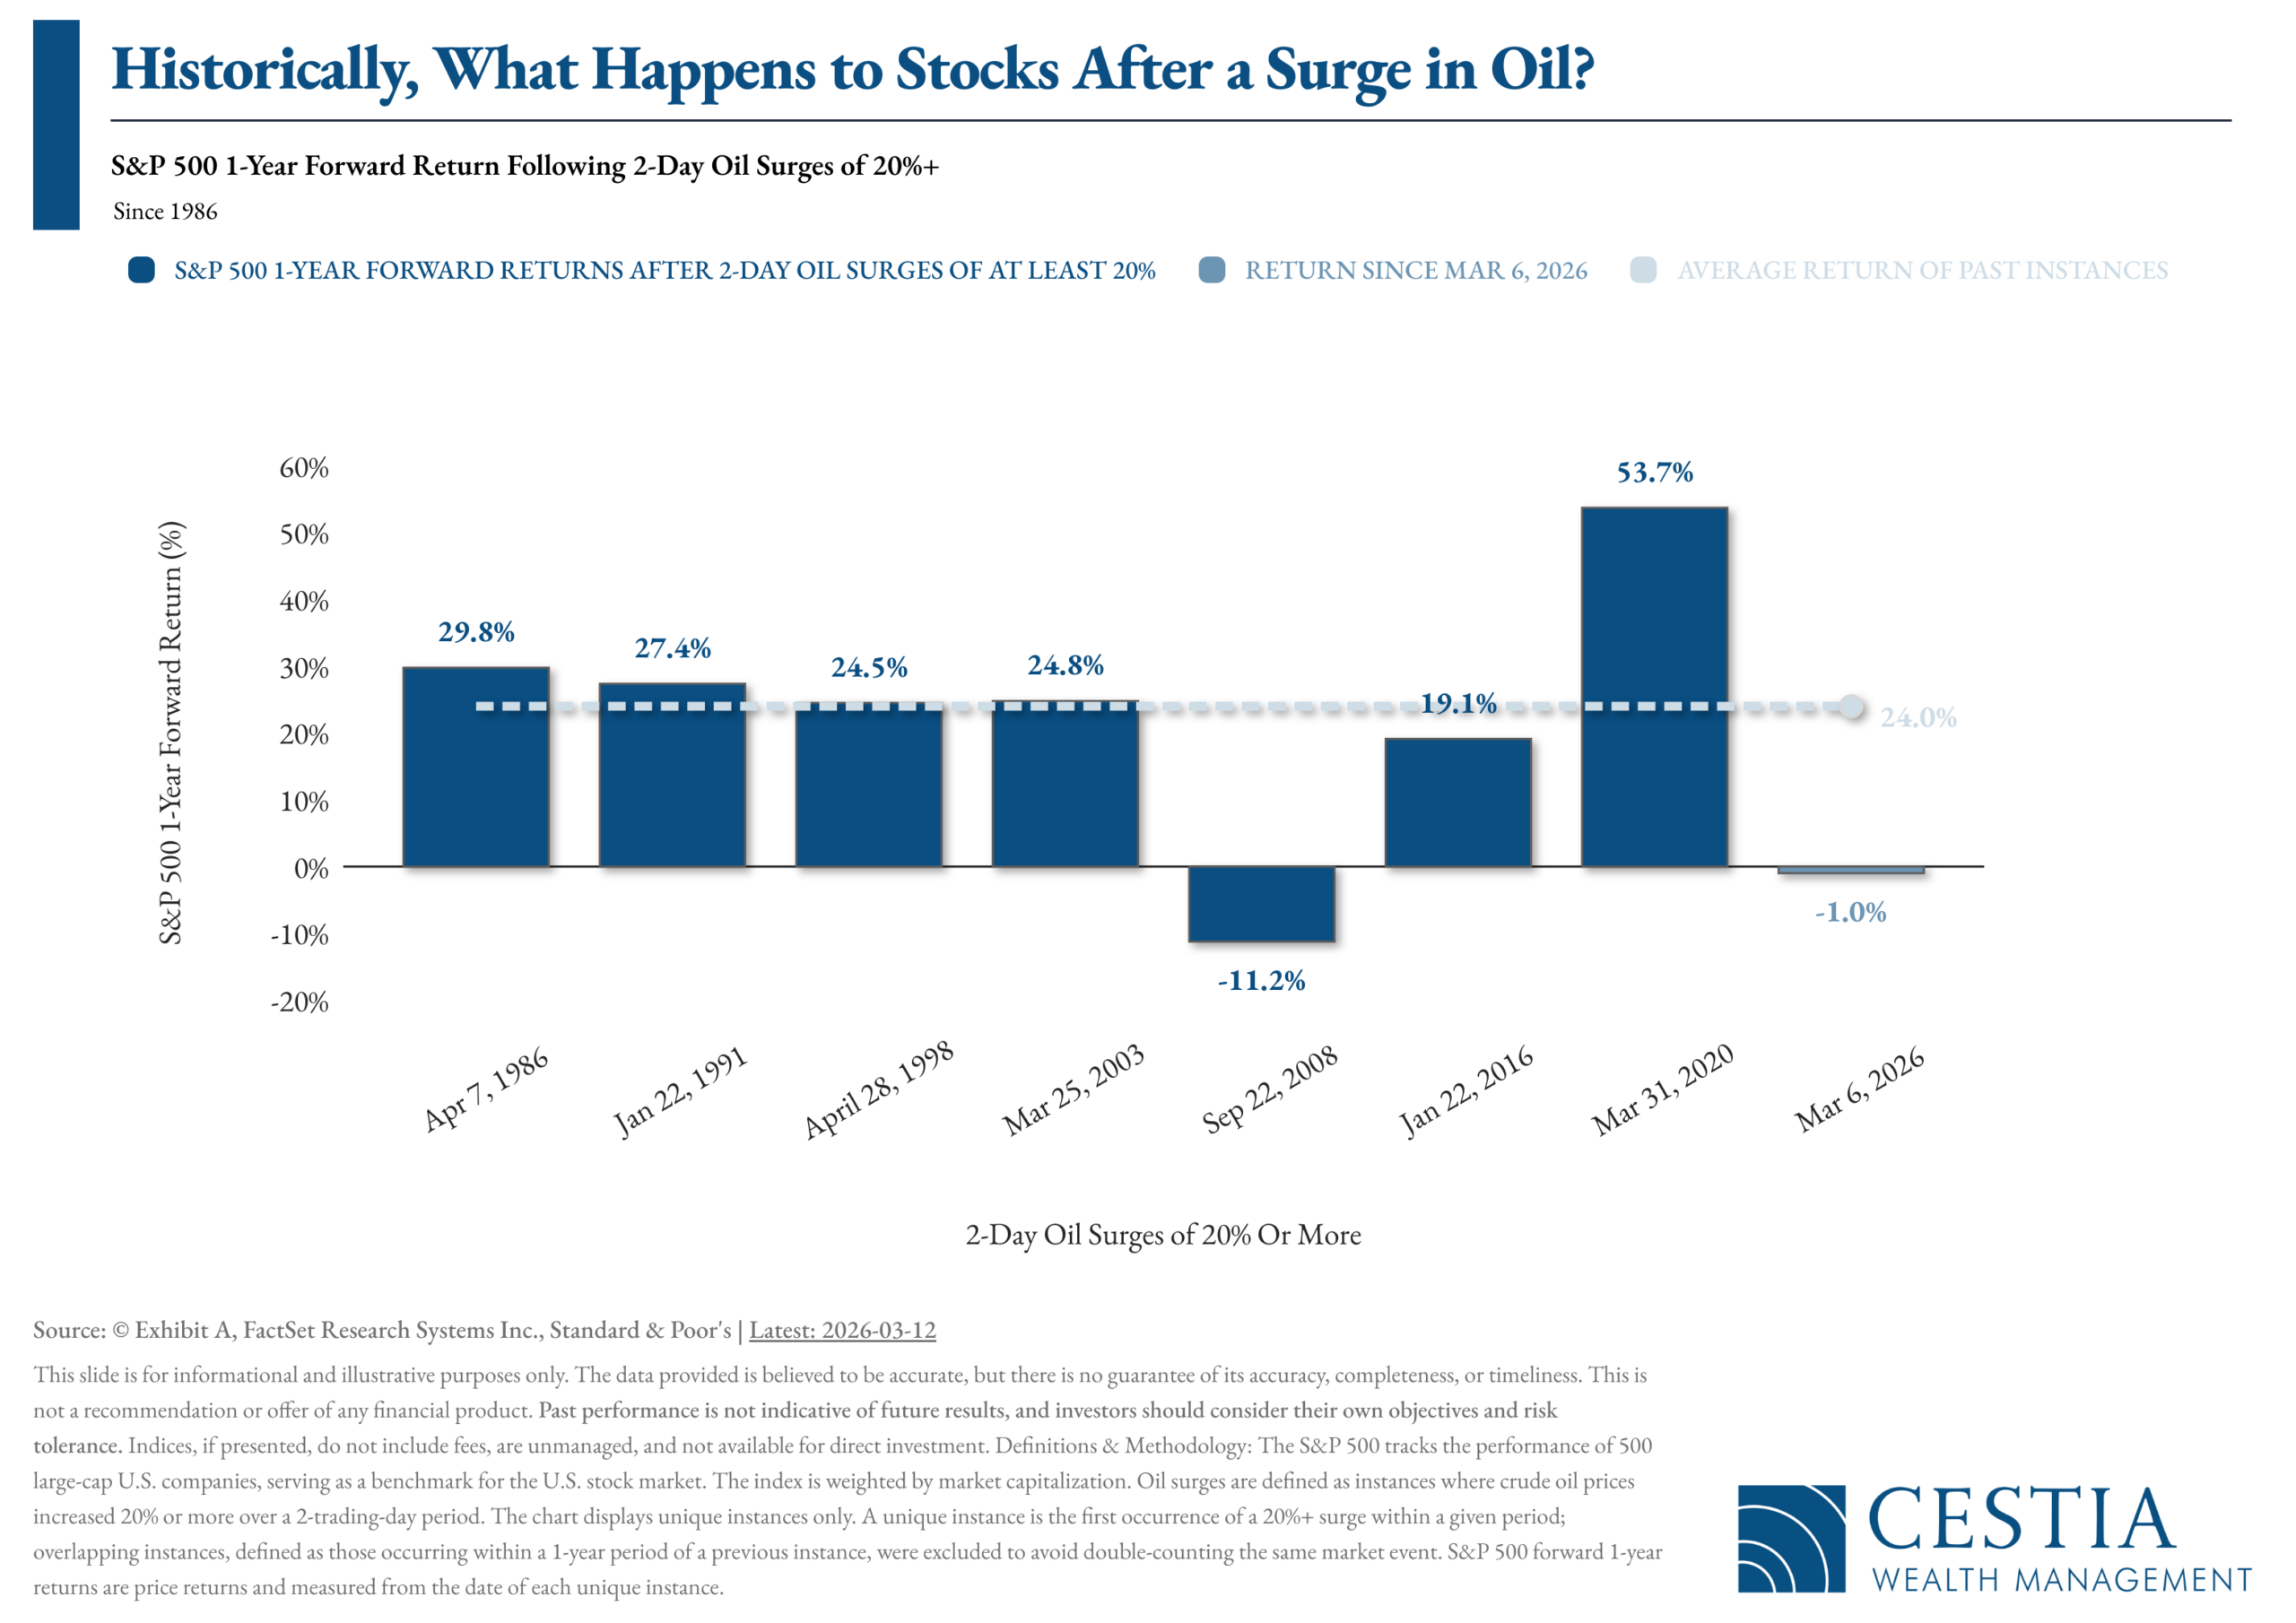
When oil prices spike sharply in a short period, it can feel unsettling — but history suggests the stock market has often weathered these moments well.
Looking back to 1986, there have been 8 times when oil surged 20% or more in just two days. In 7 out of those 8 cases, the S&P 500 was higher a year later — a pretty encouraging track record.
We’re currently in one of those moments. Since the most recent surge on March 6, 2026, the S&P 500 is down about 1% — but if history is any guide, the market has typically found its footing over the following 12 months.
Of course, past performance doesn’t guarantee future results, and every situation is different. But the pattern is worth noting as we keep a close eye on markets on your behalf.

Markets Brace for 10% Correction Without ‘Defined Off-Ramp’ from US-Iran War
Market Spinning After ‘Most Epic Price Reversal in Oil History’

What Issues Should I Consider When Reviewing Cash Flow?
The health of every financial plan depends heavily on sound cash flow planning. Creating a cash flow plan is likely a preliminary exercise conducted at the outset of our relationship. While clients tend to know what they should do, in reality they often fall short of taking even the most basic steps toward tracking and managing their cash flow. Cash flow planning can have a dramatic long-term impact on your financial well-being by simply increasing your awareness of spending and promoting discipline and accountability.
To help guide you toward creating and managing a cash flow plan that supports your lifestyle and goals, we have created this checklist. It covers cash flow planning basics, including:
- Income sources
- Essential and discretionary spending
- Debt and taxes
- Goal funding
- Monitoring strategies
SOURCE: fpPathfinder

Equities
- Equity markets fell for the third straight week, driven by inflation concerns and volatile oil prices, with crude finishing near $99/barrel
- Large caps were the most resilient; mid caps suffered the steepest losses
- Value outperformed growth across large and mid caps, continuing a year-long trend; small-cap growth narrowly edged small-cap value
- Energy (+2%) and Utilities were the only sectors to finish positive; Financials (-3.4%) and Industrials (-3.1%) led declines
- International equities underperformed domestic markets for the week, though both developed and emerging markets retain a meaningful year-to-date lead over U.S. stocks
Bonds
- The bond market sold off sharply, with yields rising across the curve; long-duration bonds were hit hardest, with long corporates down nearly 2.6%
- The 10-yr Treasury yield rose to 4.28% (from 3.97% at end of February); the 2-yr yield climbed to 3.73% (from 3.38%)
- The yield curve flattened modestly, with the 2-10 spread narrowing to 55 basis points from 59
- High-yield held up better than investment grade; IG corporate yields rose to 5.15% and high-yield to 7.54%
Macroeconomic Data
- January PCE came in at +0.3% month over month and +2.8% year over year, slightly below the 2.9% consensus
- Core PCE rose 0.4% monthly and 3.1% annually — the highest reading in nearly two years — reinforcing inflation concerns
- February CPI came in at +0.3% for the month and +2.4% year over year, with core CPI at +0.2% monthly and +2.5% annually, both in line with estimates
- Q4 2025 GDP was revised down to a 0.7% annualized rate, from the 1.4% advance estimate
- Elevated oil prices tied to the Iran conflict raise the risk that inflation pressures could intensify ahead of the Fed’s next move

(as of Monday’s Market Opening)
| Total Return (1D) | Total Return (1W) | Total Return (MTD) | Total Return (QTD) | Total Return (YTD) | |
| S&P 500 | 1.05% | -1.38% | -2.57% | -2.10% | -2.10% |
| Dow Jones Industrial Average | 1.18% | -1.32% | -3.82% | -1.99% | -1.99% |
| NASDAQ | 1.27% | -1.37% | -1.25% | -3.69% | -3.69% |
| NASDAQ 100 | 1.24% | -1.13% | -1.11% | -2.24% | -2.24% |
| Russell 1000 | 1.11% | -0.51% | -2.55% | -1.82% | -1.82% |
| Russell 2000 | 1.53% | -0.21% | -4.23% | 1.70% | 1.70% |
| Russell 3000 | 1.17% | -0.48% | -2.59% | -1.63% | -1.63% |
| ACWI | 1.38% | -0.15% | -4.01% | -0.01% | -0.01% |
Disclosures
- Wealth Mechanics™ is a registered trademark of Cestia Wealth Management. Unauthorized use of the trademark, including but not limited to commercial use, reproduction, or imitation without explicit written permission from Cestia Wealth Management, is strictly prohibited.
- Market commentary provided by NewEdge Advisors
- Charts concerning market data are provided by Exhibit A.
- Guides and other downloadable firm material respective to financial planning processes and data are provided and powered by fpPathfinder.
- Advisory services offered through NewEdge Advisors, LLC, a registered investment adviser. Securities offered through NewEdge Securities, LLC. Member FINRA/SIPC. NewEdge Advisors, LLC and NewEdge Securities, LLC are wholly owned subsidiaries of NewEdge Capital Group, LLC.
- Cestia Wealth Management is not a legal tax professional. We offer tax gap analysis for clients who desire to have a comprehensive financial plan, which requires in-depth tax strategy and planning as a distinct part of the overall customized solution. Please consult your tax professional on all matters addressed in this report.
- Information about annuities are not to be considered a recommendation. The information provided should not considered a recommendation to purchase or sell any particular security.
- Investing involves risk, including the potential loss of principal. No investment strategy can guarantee a profit or protect against loss in periods of declining values. Past performance is no guarantee of future results. Please note that individual situations can vary. Therefore, the information presented here should only be relied upon when coordinated with individual professional advice.
