



Week Ending May 1, 2026
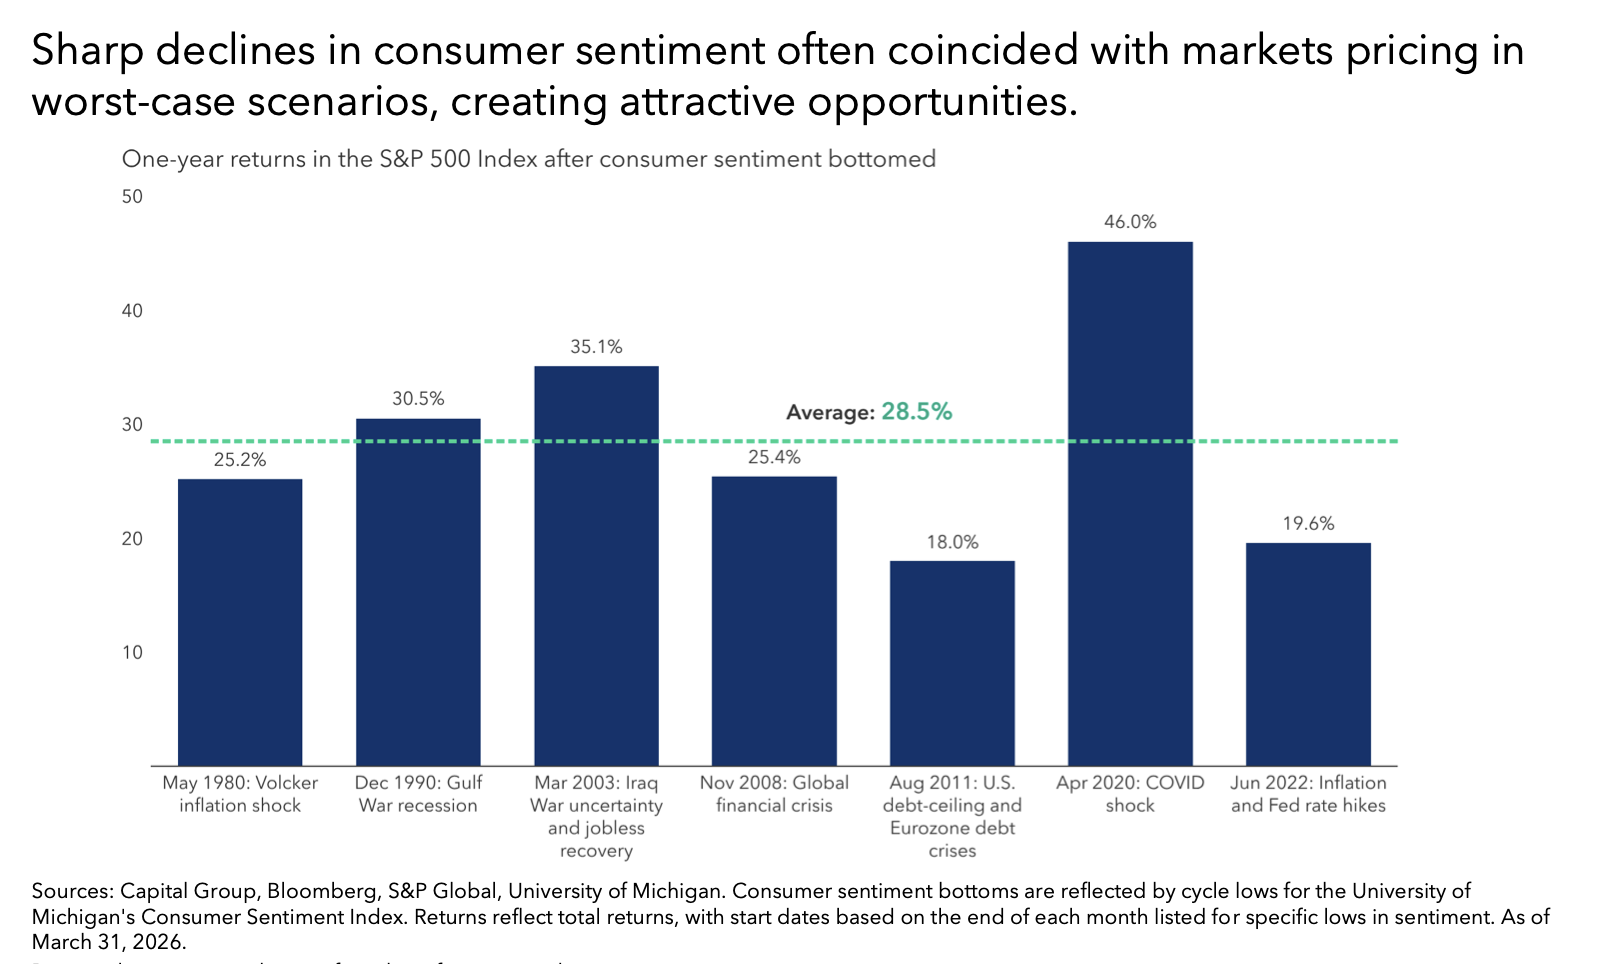
Extreme pessimism often preceded double-digit returns for equities
When consumer confidence sinks, markets typically price in lower return potential as investors anticipate that consumers will cut back on spending, which accounts for roughly 70% of U.S. GDP. The Iran war has pushed consumer sentiment in April 2026 to its lowest in history. However, market timing moves can backfire. Some of the strongest returns have occurred after consumer sentiment bottomed. Looking back at major sentiment lows — including the inflation shock of the 1980s, Covid-19 pandemic and the Federal Reserve’s rapid interest rate hikes in 2022 — returns one year later averaged 28.5%.


Sudden Wealth Event Issues
Clients can experience a variety of wealth events that lead to a financial windfall, including the sale of a business or real estate, an inheritance, lottery winnings, or a legal settlement. An increase in wealth, especially when unexpected, large, and/or sudden, requires thoughtful planning. This is a critical time to provide guidance and value to your clients, and offers a unique opportunity to make a significant positive impact.
This checklist helps guide your conversations when advising clients that experience a sudden wealth event, and covers:
- The nature, timing, and terms of the wealth event
- Cash flow impact
- Liquidity considerations
- Tax planning matters
- Long-term planning opportunities

Equities
- U.S. equity markets advanced modestly for a second consecutive week, supported by a strong corporate earnings season.
- The S&P 500 and NASDAQ each gained approximately 1%, with both benchmarks closing at new record highs; the S&P 500 surpassed 7,200 for the first time.
- With more than half of S&P 500 constituents reporting, first-quarter earnings growth is on pace to exceed 14% — a sixth consecutive quarter of double-digit growth.
- Strength has been driven by a combination of robust revenue gains and historically high profit margins.
- In a reversal from recent trends, large-cap value outperformed large-cap growth, led largely by strength in the energy sector.
- Sector performance was broad-based, led by Communication Services and Energy; Materials was the primary laggard.
- Energy leadership reflected continued gains in oil prices, with Brent crude touching $126 per barrel intraday on Thursday.
- International results were mixed: developed foreign markets advanced for the week, while emerging markets declined.
Bonds
- Bond prices declined as yields rose across the curve, with rising oil prices and a resilient labor market tempering expectations for rate cuts later this year.
- The 10-year Treasury yield closed the week at 4.39%; the 2-year finished at 3.88%, leaving the 2s–10s spread at 51 basis points.
- The Bloomberg U.S. Aggregate Index returned -0.39% for the week, while high-yield bonds returned 0.05%.
- Corporate performance was generally negative, with weakness most pronounced at the longer end of the curve as yields adjusted higher.
- Short-term government and corporate bonds returned -0.19%, while long-term Treasuries returned -0.85%.
- Investment-grade corporate yields ended the week at 5.14%; high-yield corporate yields finished at 7.24%.
Macroeconomic Data
- The data calendar offered a mixed read on the U.S. economy.
- Consumer confidence rose to 92.8 in April, a four-month high, as a stronger labor market outlook and rising equity prices offset concerns over higher gasoline prices and Middle East tensions.
- The FOMC held the federal funds rate steady at 3.50%–3.75% for a third consecutive meeting; four members dissented — three opposing the use of easing language and one in favor of an immediate rate cut.
- First-quarter U.S. real GDP grew at an annualized rate of 2.0%, modestly below expectations, with growth concentrated in AI-related investment and government spending.
- Headline PCE rose to 3.5% year-over-year in March — its highest level since August 2023 — and increased 0.7% month-over-month.
- Core PCE rose 3.2% in March, the fastest pace since November 2023.
- Personal income increased 0.6% in March, while personal spending rose 0.9%.
- The ISM Manufacturing Index held at a four-year high of 52.7% in April, marking a fourth consecutive month of expansion.

(as of Monday’s Market Opening)
| Total Return (1D) | Total Return (1W) | Total Return (MTD) | Total Return (QTD) | Total Return (YTD) | |
| S&P 500 | -0.10% | 0.69% | 0.20% | 10.64% | 5.52% |
| Dow Jones Industrial Average | -0.50% | 0.17% | -0.80% | 6.28% | 2.47% |
| NASDAQ | 0.13% | 1.04% | 1.02% | 16.47% | 8.20% |
| NASDAQ 100 | -0.05% | 1.43% | 0.89% | 16.66% | 9.69% |
| Russell 1000 | -0.12% | 0.70% | 0.15% | 10.34% | 5.60% |
| Russell 2000 | -0.44% | 0.50% | 0.03% | 12.11% | 13.15% |
| Russell 3000 | -0.11% | 0.66% | 0.18% | 10.31% | 5.91% |
| ACWI | -0.09% | 0.68% | -0.01% | 9.50% | 7.09% |
Global Client Survey
We’re inviting you to take part in a quick, anonymous client survey. Your feedback helps us fine-tune our process, elevate your experience, and ensure we’re delivering what matters most to you. This isn’t just about checking a box—it’s about shaping the future of how we serve you. Your voice helps guide our next steps. We’re listening. We’re learning. And we’re grateful for your trust.
Take Our Survey Now (click here)
Disclosures
- Wealth Mechanics™ is a registered trademark of Cestia Wealth Management. Unauthorized use of the trademark, including but not limited to commercial use, reproduction, or imitation without explicit written permission from Cestia Wealth Management, is strictly prohibited.
- Market commentary provided by NewEdge Advisors
- Charts concerning market data are provided by Exhibit A.
- Guides and other downloadable firm material respective to financial planning processes and data are provided and powered by fpPathfinder.
- Advisory services offered through NewEdge Advisors, LLC, a registered investment adviser. Securities offered through NewEdge Securities, LLC. Member FINRA/SIPC. NewEdge Advisors, LLC and NewEdge Securities, LLC are wholly owned subsidiaries of NewEdge Capital Group, LLC.
- Cestia Wealth Management is not a legal tax professional. We offer tax gap analysis for clients who desire to have a comprehensive financial plan, which requires in-depth tax strategy and planning as a distinct part of the overall customized solution. Please consult your tax professional on all matters addressed in this report.
- Information about annuities are not to be considered a recommendation. The information provided should not considered a recommendation to purchase or sell any particular security.
- Investing involves risk, including the potential loss of principal. No investment strategy can guarantee a profit or protect against loss in periods of declining values. Past performance is no guarantee of future results. Please note that individual situations can vary. Therefore, the information presented here should only be relied upon when coordinated with individual professional advice.
