



Week Ending August 7, 2026
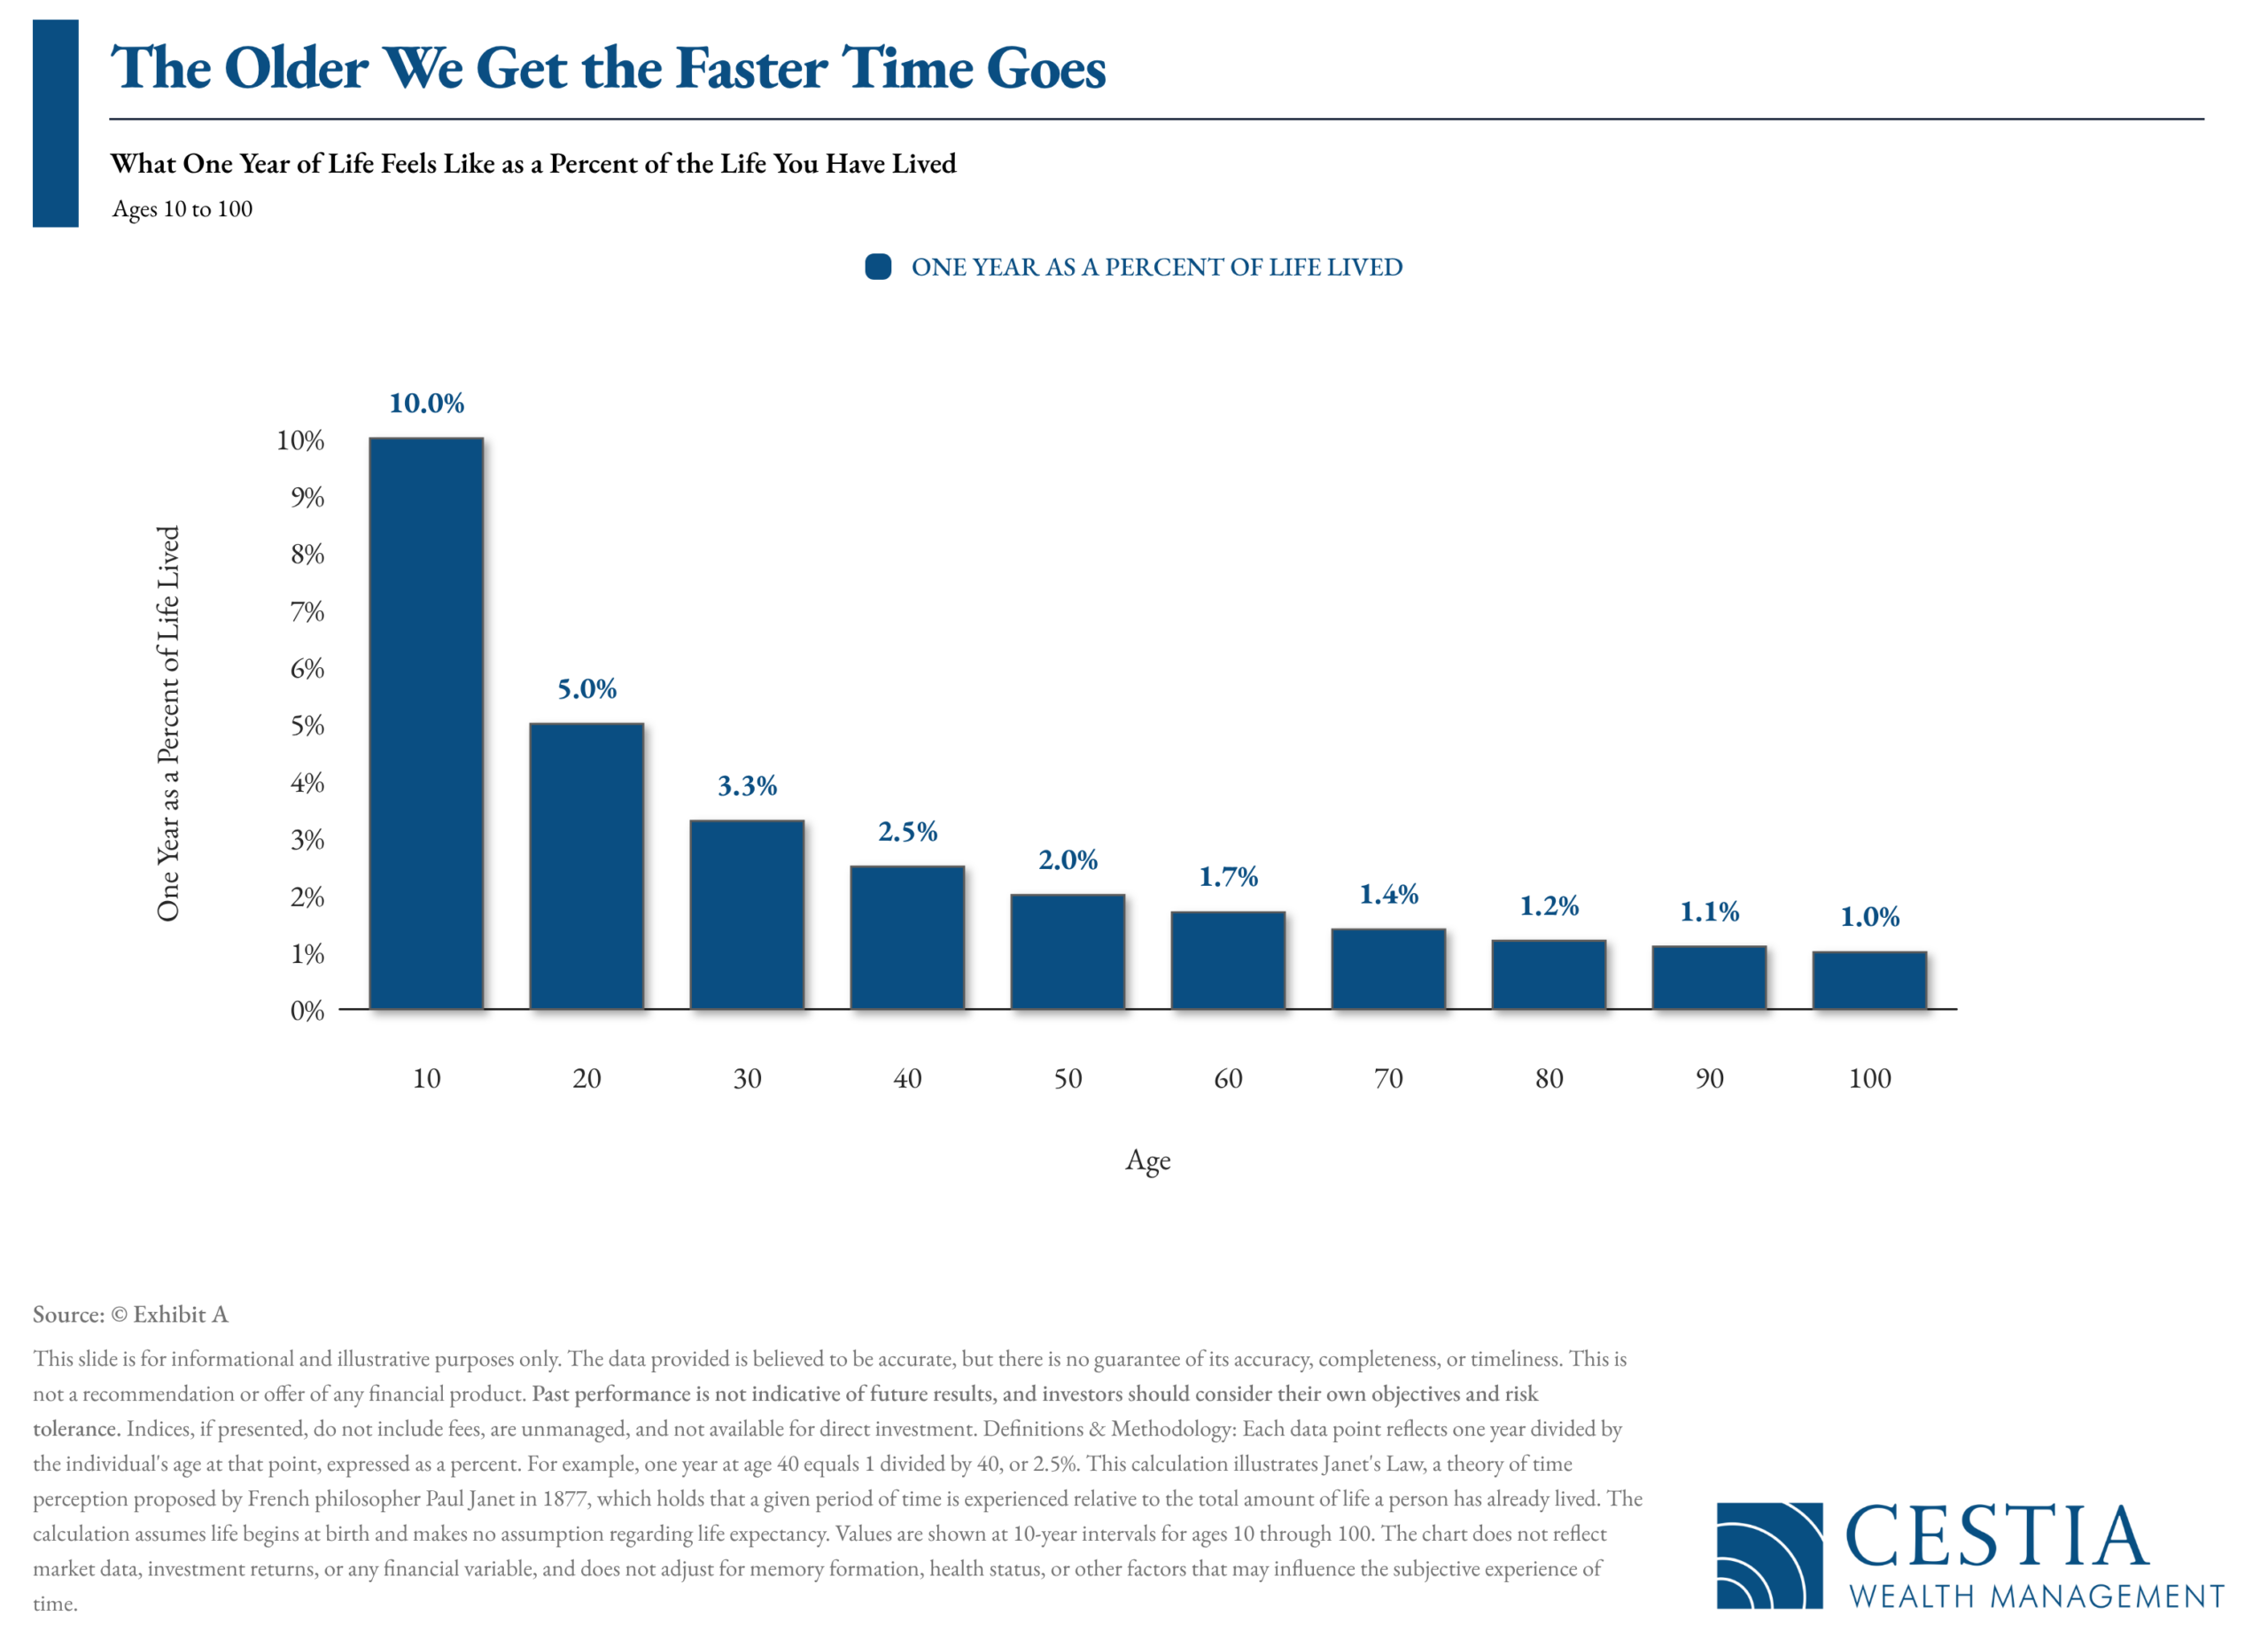
The Older We Get the Faster Time Goes
Why Time Feels Faster: You have probably noticed that a year does not feel as long as it used to. Back in 1877, a French philosopher named Paul Janet suggested a reason. Every year you live gets measured against all the years that came before it, so the pile you are comparing it to keeps growing.
What the Chart Shows: At age 10, one year is a full tenth of everything you have lived. At 50, that same year is only 2%. At 100, it is 1%. The year itself never gets shorter. It just keeps shrinking next to the life behind it.
What It Means for You: This is worth keeping in mind when we talk about the timing of your goals, whether that is travel, family time, or something you have been putting off. Let’s make sure your plan reflects not just what you can afford, but when you will most enjoy it. Any changes we consider will account for longevity, healthcare costs, and what you want to leave behind.

Bond Markets Throw Shade on New Fed Chair’s Inflation Strategy
Goldman Sacks’ “Balancing Innovation and Inflation in Portfolios”
Fed Scours Fresh Inflation Data for Interest-Rate Cues as Mid-Term Elections Loom

Am I Impacted By The Social Security Fairness Act?
Navigating the changes brought by the Social Security Fairness Act of 2023 can be complex, but it’s crucial for your financial plan. The repeal of the Windfall Elimination Provision (WEP) and Government Pension Offset (GPO) may increase your benefits and overall income stream.
To help, we’ve created the “Am I Impacted by the Social Security Fairness Act?” flowchart. It addresses key considerations such as:
- How benefit increases will be applied
- Potential planning considerations for spousal or survivor benefits
- The impact on how one pays for Medicare premiums
- Considerations for retiring sooner
- The importance of updating contact information

Markets are looking to extend last week’s strength, which saw major indices rally sharply to new highs. The move was driven by a sharp rebound in the Magnificent 7 and the broader tech cohort — yet, notably, these more growth-oriented indices (Mag 7, semiconductors, the Technology sector, Russell 1000 Growth, the Korean KOSPI) remain below their all-time highs, while more value-oriented measures (the equal-weight S&P 500, Russell 1000 Value, MSCI International Developed, STOXX Europe 50) are already back at new highs. That mix is keeping breadth healthy even as some of the index’s largest weights play catch-up.
Monday also brings a wave of upgrades to sell-side S&P 500 price targets, with strength in earnings cited for the bullishness. Second-quarter results have been extraordinary: 88% of companies have beaten estimates — well above average — delivering roughly 50% earnings growth (about 32% adjusting for one-time items at Amazon and Alphabet). Revenue growth has been strong too, running near 15%, boosted by Energy (+43% YoY) and Technology (+36% YoY); even excluding those two sectors, revenues are growing about 9.7% YoY.
On the economic calendar, markets will look to Wednesday’s CPI and Thursday’s PPI for a catalyst to shift Fed rate-hike expectations. Even after last week’s softer jobs data, the bond market is still pricing a 43% chance of a September hike. Retail sales this week will also offer a read on how consumers are holding up, with prices continuing to rise faster than wages.

(as of Monday’s Market Opening)
| Total Return (1D) | Total Return (1W) | Total Return (MTD) | Total Return (QTD) | Total Return (YTD) | |
| S&P 500 | 0.62% | 2.07% | 3.58% | 3.44% | 13.32% |
| Dow Jones Industrial Average | 0.28% | 1.61% | 2.96% | 3.28% | 12.43% |
| NASDAQ | 1.30% | 3.00% | 5.19% | 1.82% | 14.84% |
| NASDAQ 100 | 1.19% | 3.29% | 5.12% | -1.83% | 17.71% |
| Russell 1000 | 0.75% | 3.69% | 3.69% | 3.40% | 13.89% |
| Russell 2000 | 1.11% | 3.56% | 3.56% | 0.37% | 23.02% |
| Russell 3000 | 0.76% | 3.63% | 3.63% | 3.26% | 14.30% |
| ACWI | 0.84% | 3.20% | 3.20% | 2.85% | 14.84% |
Global Client Survey
We’re inviting you to take part in a quick, anonymous client survey. Your feedback helps us fine-tune our process, elevate your experience, and ensure we’re delivering what matters most to you. This isn’t just about checking a box—it’s about shaping the future of how we serve you. Your voice helps guide our next steps. We’re listening. We’re learning. And we’re grateful for your trust.
Take Our Survey Now (click here)
Disclosures
- Wealth Mechanics™ is a registered trademark of Cestia Wealth Management. Unauthorized use of the trademark, including but not limited to commercial use, reproduction, or imitation without explicit written permission from Cestia Wealth Management, is strictly prohibited.
- Market commentary provided by NewEdge Advisors
- Charts concerning market data are provided by Exhibit A.
- Guides and other downloadable firm material respective to financial planning processes and data are provided and powered by fpPathfinder.
- Advisory services offered through NewEdge Advisors, LLC, a registered investment adviser. Securities offered through NewEdge Securities, LLC. Member FINRA/SIPC. NewEdge Advisors, LLC and NewEdge Securities, LLC are wholly owned subsidiaries of NewEdge Capital Group, LLC.
- Cestia Wealth Management is not a legal tax professional. We offer tax gap analysis for clients who desire to have a comprehensive financial plan, which requires in-depth tax strategy and planning as a distinct part of the overall customized solution. Please consult your tax professional on all matters addressed in this report.
- Information about annuities are not to be considered a recommendation. The information provided should not considered a recommendation to purchase or sell any particular security.
- Investing involves risk, including the potential loss of principal. No investment strategy can guarantee a profit or protect against loss in periods of declining values. Past performance is no guarantee of future results. Please note that individual situations can vary. Therefore, the information presented here should only be relied upon when coordinated with individual professional advice.
