



Week Ending March 20, 2026
WEEKLY TOUCHPOINT
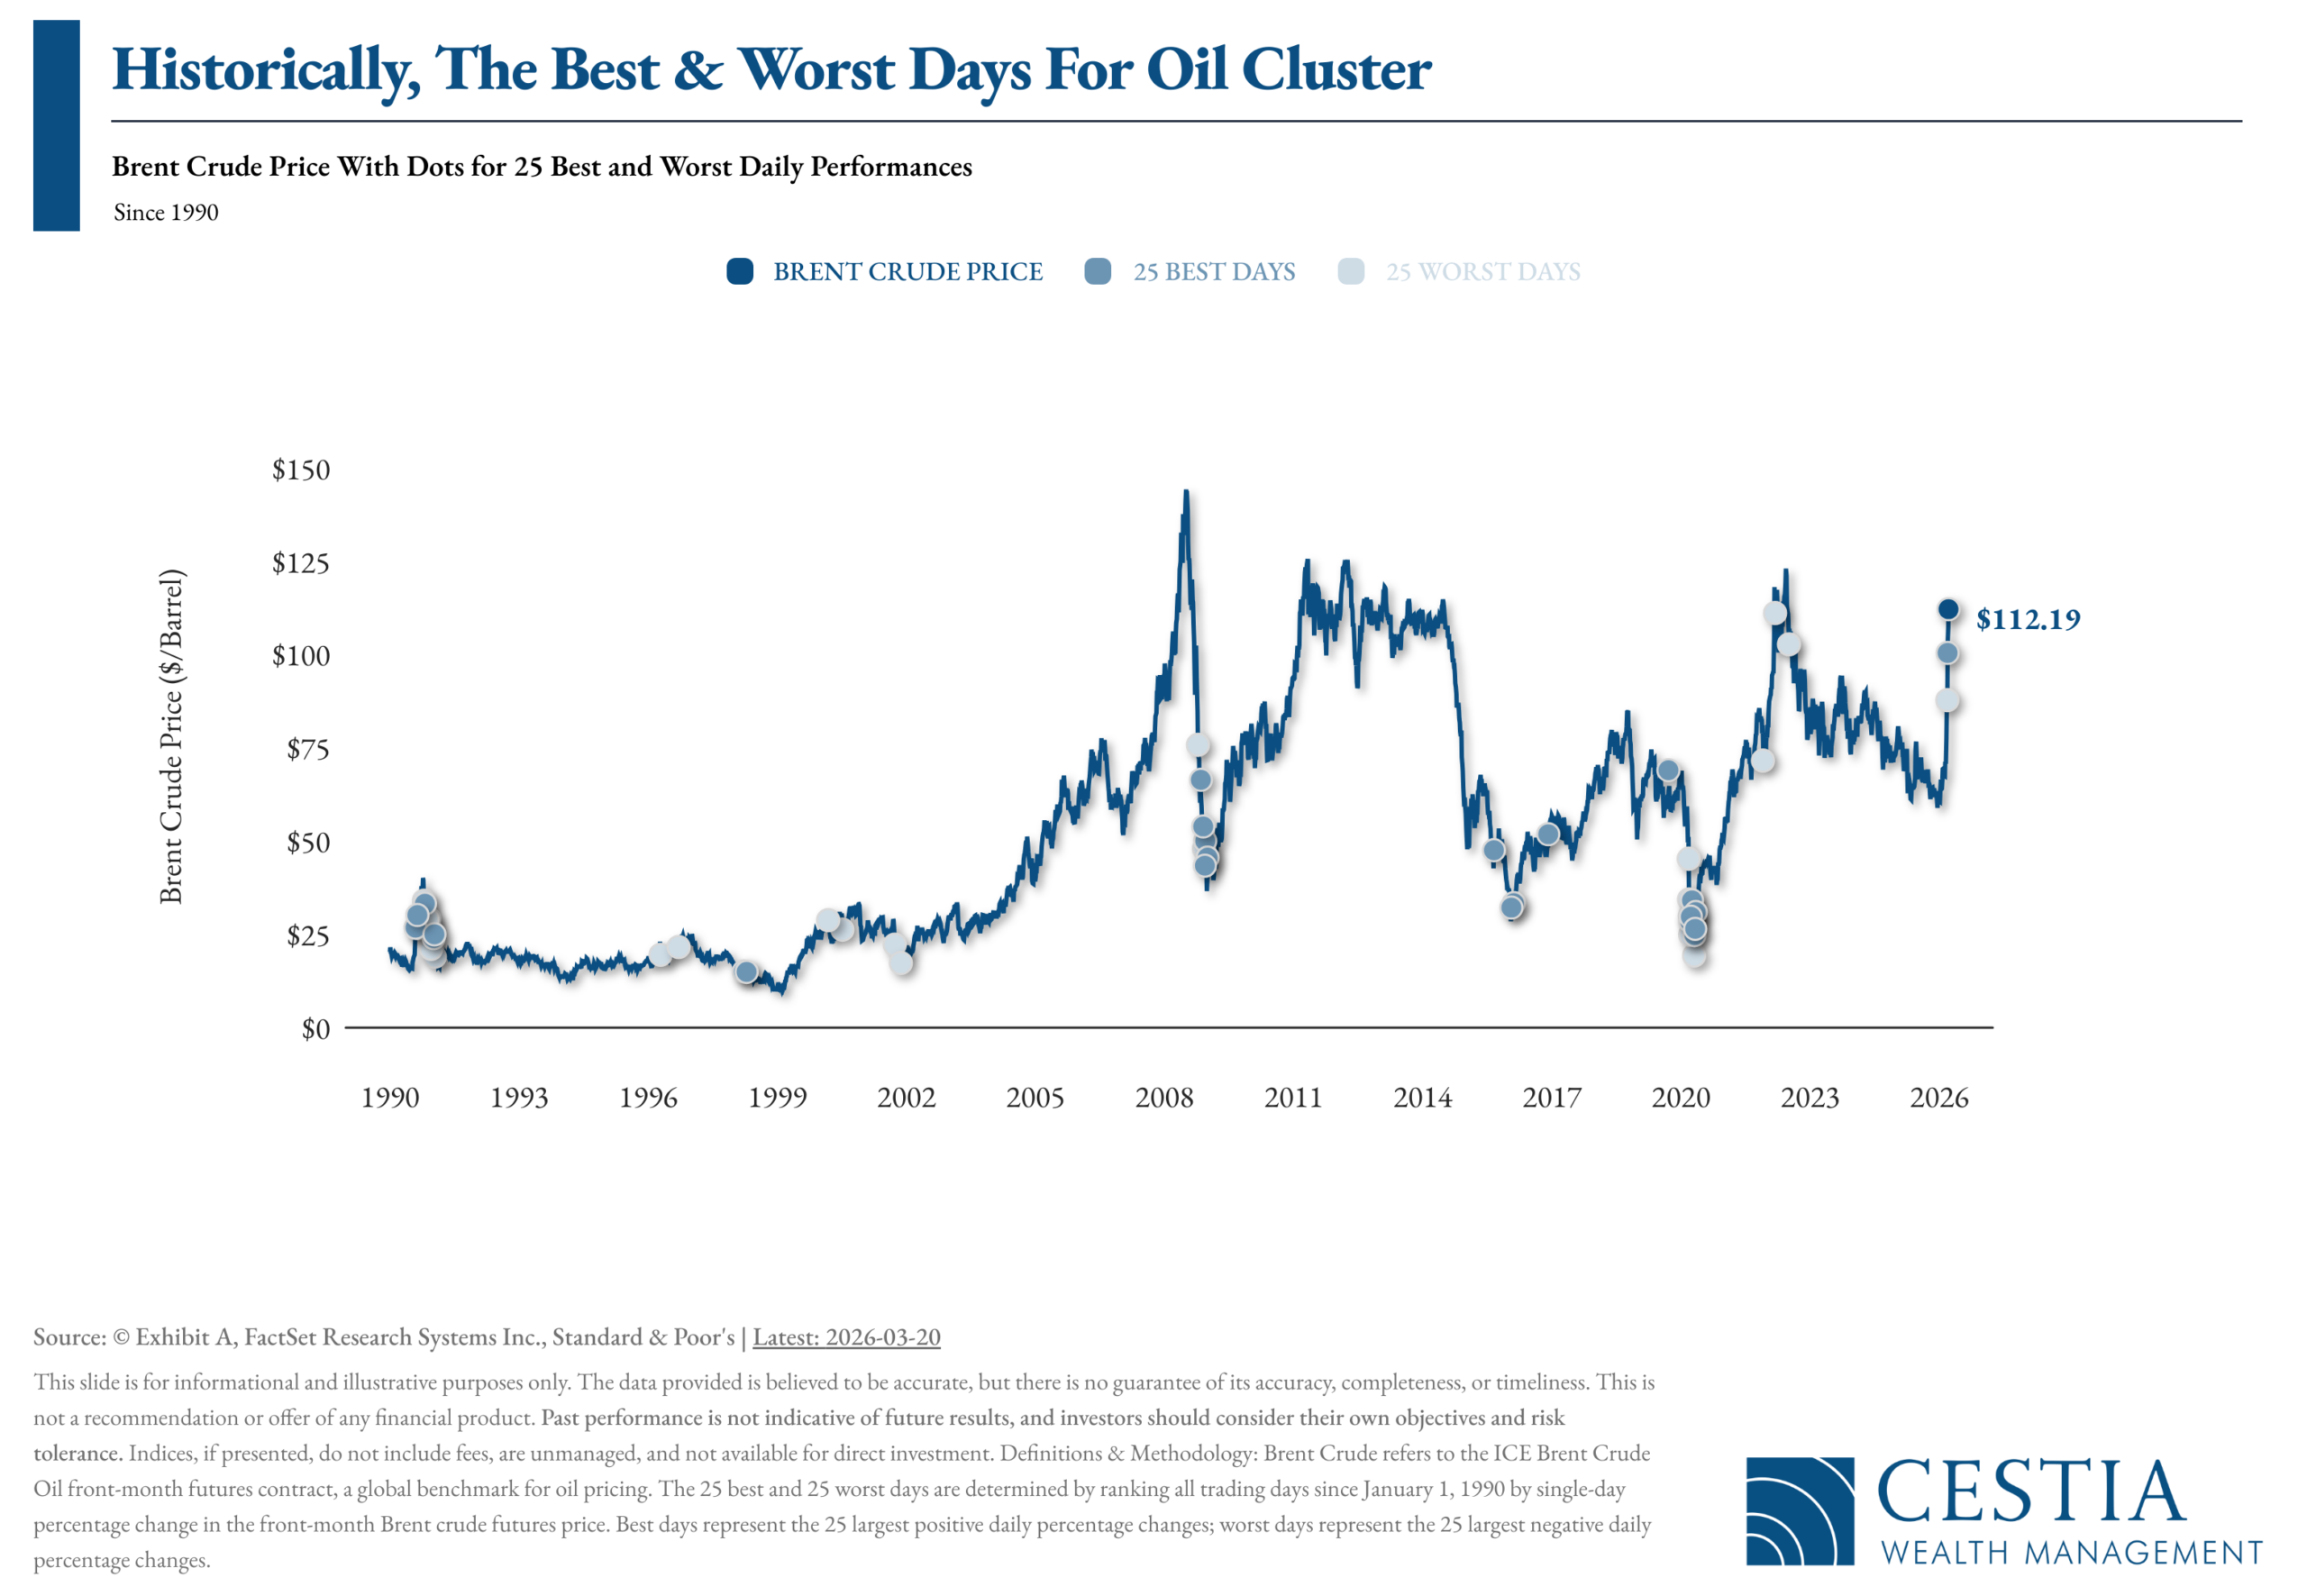
Oil’s Wild Swings: What History Tells Us
When oil moves big, it rarely moves alone. A look at Brent crude going back to 1990 shows that the 25 best and 25 worst single-day price moves don’t scatter evenly across decades — they cluster. The 2008 financial crisis, the 2014–2016 price collapse, and the 2020 pandemic each produced violent swings in both directions, often within days of each other.
The pattern matters today. Large up days in oil have historically arrived alongside — not instead of — large down days. Volatility begets volatility. For investors watching recent crude swings with optimism, history urges a second look. Past performance is not indicative of future results.

Mastercard Embraces Digital Future with $1.8 Billion Bet on Stablecoin
Shock After Shock: Fed Fears Iran War May Fuel Higher Inflation

Longevity Risk & Outliving Assets
This checklist helps guide investors who are worried about running out of money in retirement, and covers:
- Lifestyle assumptions and spending expectations
- Guaranteed income sources like Social Security, pensions, and annuities
- Portfolio withdrawal strategies and tax coordination
- Housing assets and insurance-based solutions
SOURCE: fpPathfinder

Equities
- Broad-based selloff driven by hawkish Fed and Middle East uncertainty
- Energy the lone gainer (+2.75%); Utilities worst performer (-5%)
- Mid-caps held up best; large-caps lagged
- Growth trailed value; developed international fell more than domestic
Bonds
- Yields rose across the board; prices fell
- Long-duration Treasuries hit hardest; short-duration and high-yield outperformed
- 10-yr Treasury: 4.39% | 2-yr: 3.88% | Yield curve: 51 bps
Macro
- Fed held rates at 3.50–3.75% (11-1 vote)
- Inflation forecast revised higher; 2026 PCE projected at 2.7%
- Dot plot still signals one cut this year, but skewed more hawkish
- Powell flagged Middle East as wildcard for growth and inflation
- February PPI surprised to the upside (+0.7%)
- Industrial production and jobless claims beat; regional manufacturing mixed

(as of Monday’s Market Opening)
| Total Return (1D) | Total Return (1W) | Total Return (MTD) | Total Return (QTD) | Total Return (YTD) | |
| S&P 500 | 1.88% | -1.05% | -3.63% | -3.16% | -3.16% |
| Dow Jones Industrial Average | 2.10% | -0.87% | -4.99% | -3.18% | -3.18% |
| NASDAQ | 1.96% | -1.35% | -2.63% | -5.04% | -5.04% |
| NASDAQ 100 | 2.01% | -1.12% | -2.33% | -3.45% | -3.45% |
| Russell 1000 | 1.81% | -0.11% | -3.73% | -3.00% | -3.00% |
| Russell 2000 | 2.91% | 1.26% | -4.48% | 1.44% | 1.44% |
| Russell 3000 | 1.84% | -0.02% | -3.74% | -2.80% | -2.80% |
| ACWI | 2.15% | -0.05% | -5.36% | -1.42% | -1.42% |
Disclosures
- Wealth Mechanics™ is a registered trademark of Cestia Wealth Management. Unauthorized use of the trademark, including but not limited to commercial use, reproduction, or imitation without explicit written permission from Cestia Wealth Management, is strictly prohibited.
- Market commentary provided by NewEdge Advisors
- Charts concerning market data are provided by Exhibit A.
- Guides and other downloadable firm material respective to financial planning processes and data are provided and powered by fpPathfinder.
- Advisory services offered through NewEdge Advisors, LLC, a registered investment adviser. Securities offered through NewEdge Securities, LLC. Member FINRA/SIPC. NewEdge Advisors, LLC and NewEdge Securities, LLC are wholly owned subsidiaries of NewEdge Capital Group, LLC.
- Cestia Wealth Management is not a legal tax professional. We offer tax gap analysis for clients who desire to have a comprehensive financial plan, which requires in-depth tax strategy and planning as a distinct part of the overall customized solution. Please consult your tax professional on all matters addressed in this report.
- Information about annuities are not to be considered a recommendation. The information provided should not considered a recommendation to purchase or sell any particular security.
- Investing involves risk, including the potential loss of principal. No investment strategy can guarantee a profit or protect against loss in periods of declining values. Past performance is no guarantee of future results. Please note that individual situations can vary. Therefore, the information presented here should only be relied upon when coordinated with individual professional advice.
