



Week Ending May 22, 2026
Bond Yields are Historically Linked with Forward Returns
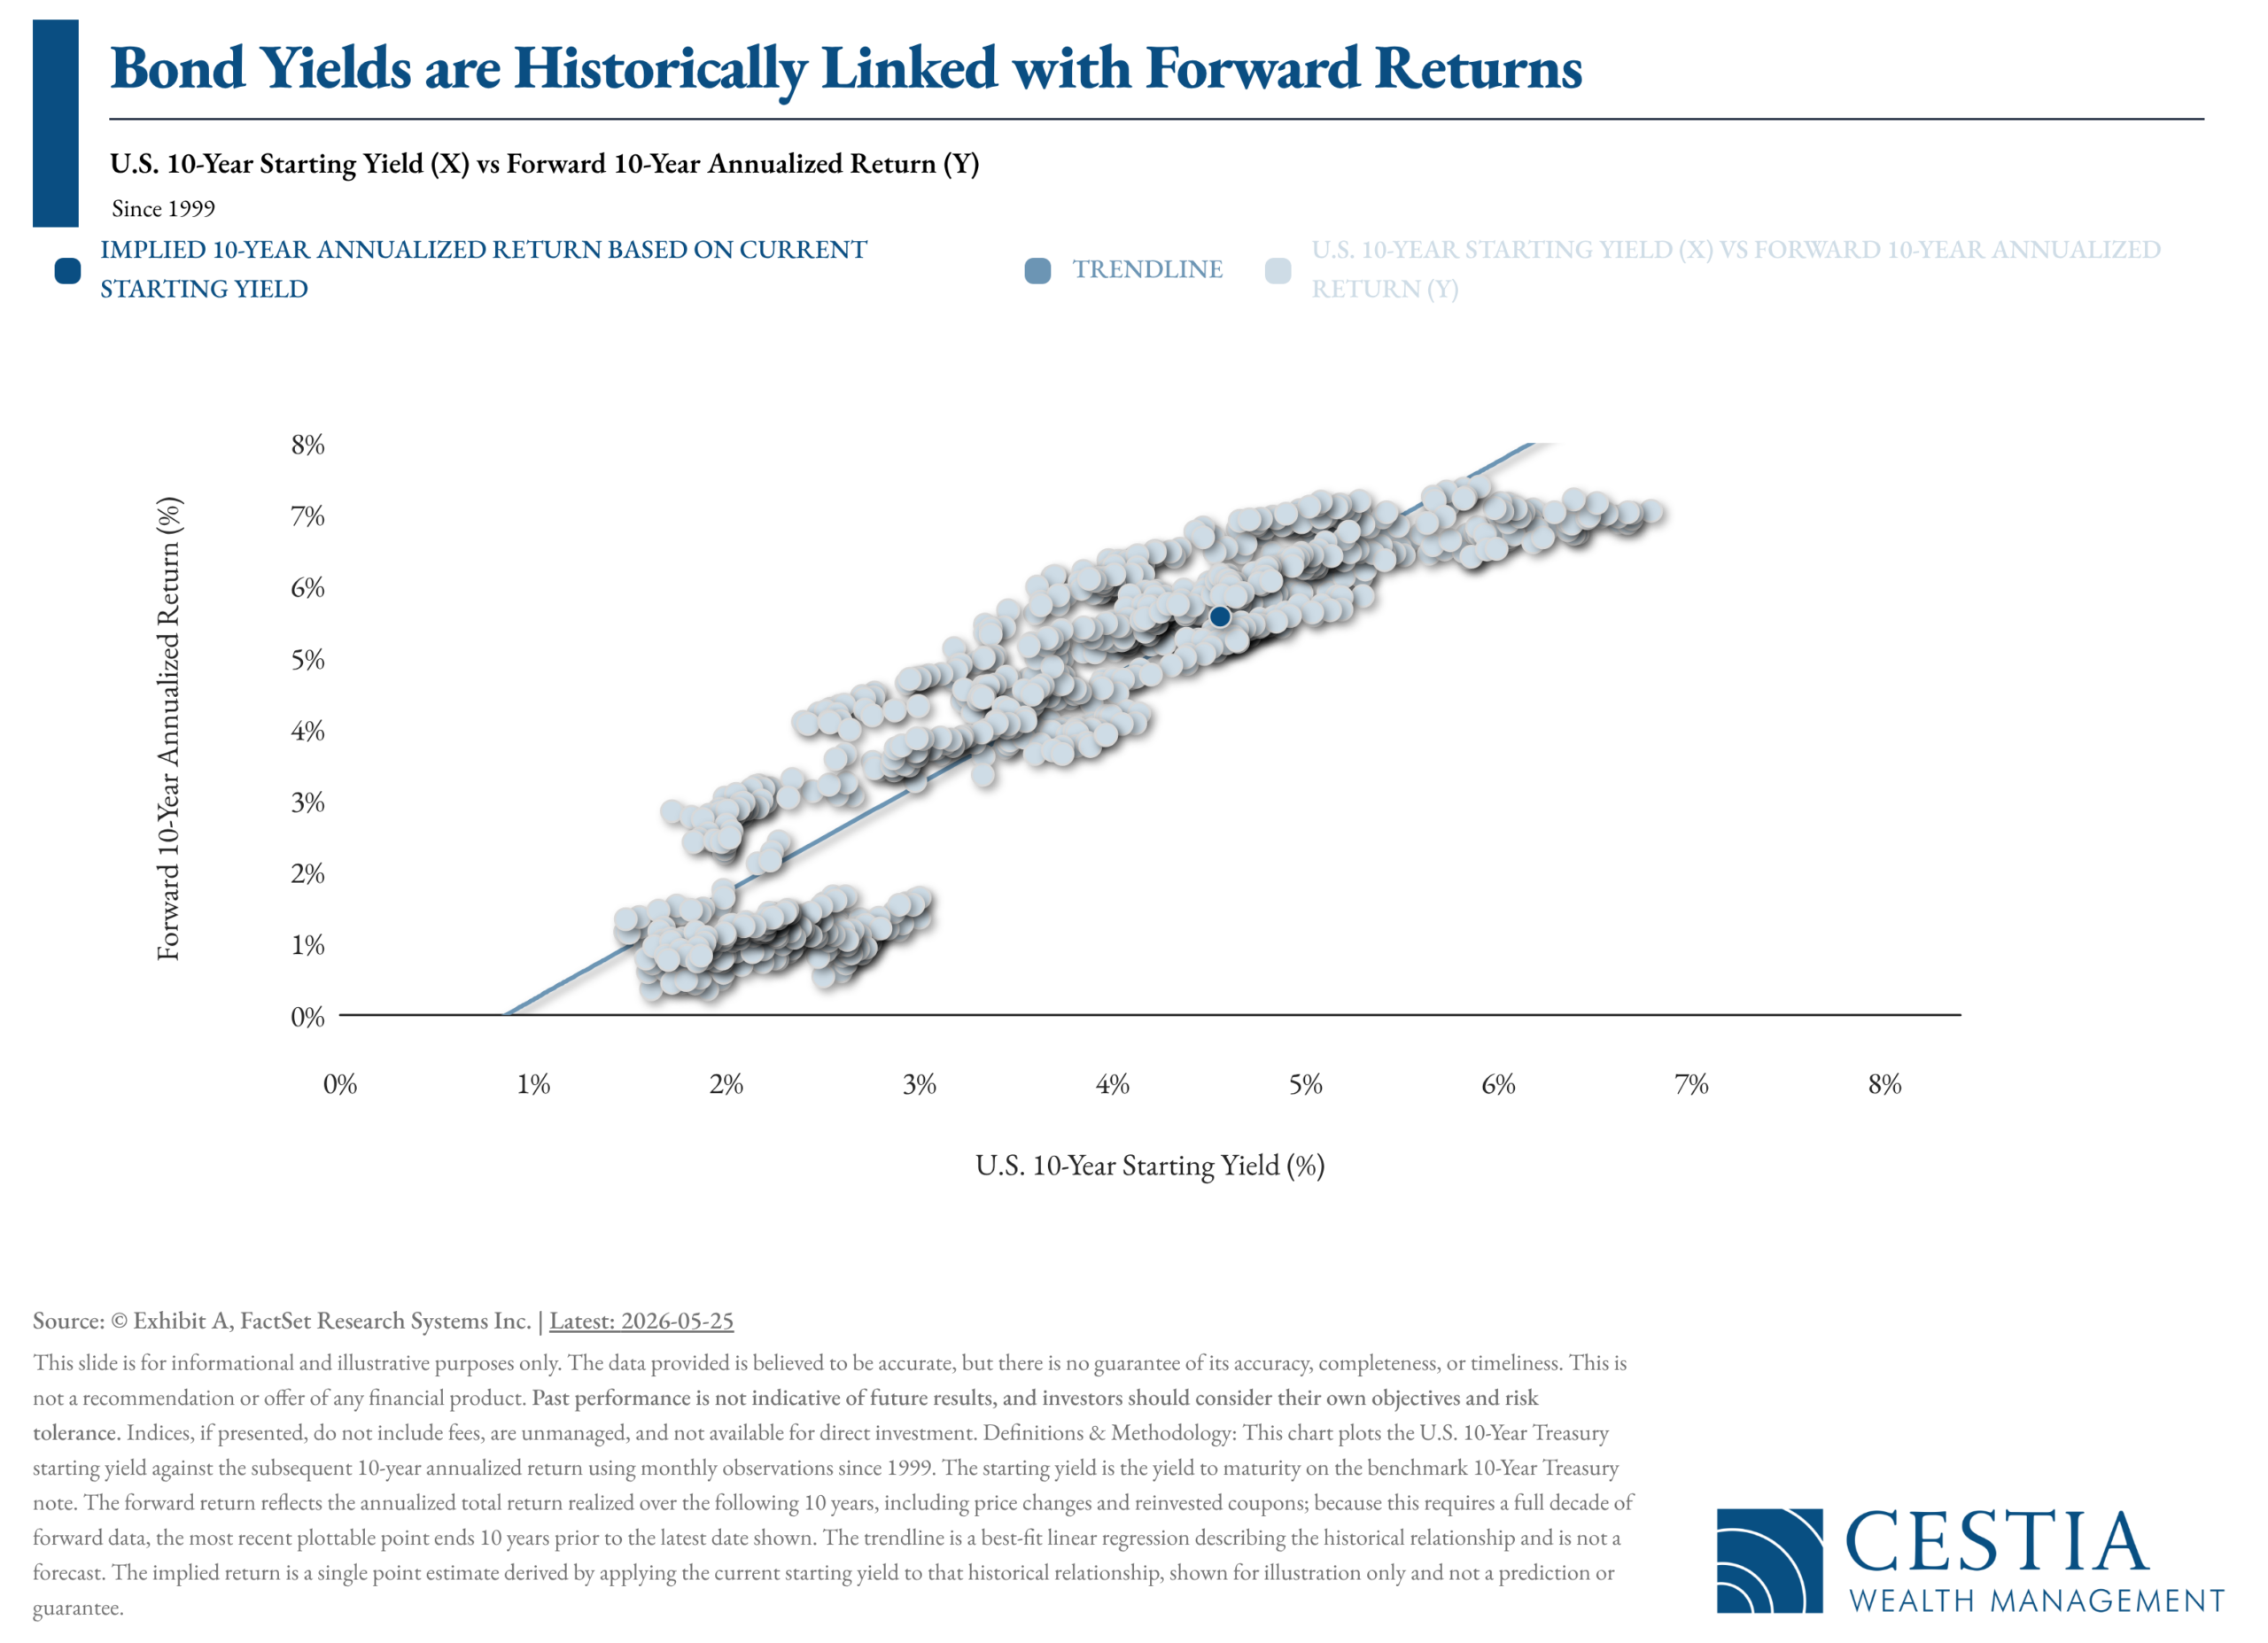
One of the more enduring relationships in fixed income markets is the link between the U.S. 10-Year Treasury’s starting yield and its forward 10-year annualized return. Plotting this relationship back to 1999 reveals a consistent pattern: the yield at which an investor begins their holding period has historically been a meaningful indicator of the return they can expect to earn over the subsequent decade.
Applying that historical relationship to today’s market, the current 10-Year Treasury yield of approximately 4.6% implies a forward 10-year annualized return of roughly 5.6%. It is worth emphasizing that this figure is a single point estimate drawn from past data — it is not a forecast, and it does not account for the path of rates, inflation, or credit conditions that will ultimately shape realized returns.
The broader takeaway is one of context rather than prediction. Higher starting yields have historically been associated with stronger forward returns for bondholders, which is why the level of rates today may serve as a reasonable anchor for setting return expectations within a diversified portfolio. As always, the historical relationship may not persist, and actual future returns may differ materially from what past data suggests. Still, for clients evaluating the role of fixed income in their long-term plan, today’s yield environment offers a more constructive starting point than has been available in much of the past fifteen years.

Why Is Oil Moving Lower Today?
What Happens to Oil if Iran Permanently Taxes Hormuz Traffic?

A Foundation in Digital Assets, Part 1: What Is Blockchain?
Before clients can meaningfully evaluate cryptocurrencies, stablecoins, or decentralized finance, it helps to begin with the underlying technology that makes all of them possible: blockchain.
At its simplest, a blockchain is a shared digital record of transactions. Rather than being stored on a single company’s server — the way a bank maintains your account balance — the record is distributed across a network of computers that each hold an identical copy. When a new transaction occurs, the network collectively verifies it, and once added to the record, the entry cannot be altered without the consensus of the network.
Two features make this design notable. The first is transparency: every participant can see the same ledger, which reduces the need to trust any single intermediary. The second is immutability: once recorded, entries are extremely difficult to change, which creates a permanent, auditable history.
Blockchain is the technology layer. It is not, by itself, an investment. Bitcoin, Ethereum, and the broader universe of digital assets are applications built on blockchain — much in the way that email and online banking are applications built on the internet. Understanding this distinction is the first step in evaluating the asset class with clarity.
In the next installment, we will examine the difference between digital currency and cryptocurrency — terms that are often used interchangeably but describe meaningfully different things.
Source: Educational framework adapted from materials published by the Digital Assets Council of Financial Professionals (DACFP), an independent educational organization recognized by the CFP Board of Standards, CFA Institute, and listed in FINRA’s database of professional designations.

Equities
- S&P 500 rose 0.91%, marking its eighth consecutive weekly gain — the longest streak since 2023
- Dow Jones Industrial Average climbed to an all-time high of 50,579
- Small-cap and value stocks outperformed; equal-weighted S&P 500 beat the cap-weighted index, signaling broader market participation
- Health care led S&P 500 sectors, gaining over 3.3% as investors diversified exposure
- NVIDIA’s stronger-than-expected earnings lifted technology and semiconductor shares amid continued AI enthusiasm
- International markets posted broad gains on Middle East de-escalation hopes and robust memory chip demand
Bonds
- 30-year Treasury yield spiked to 5.19% on Tuesday — its highest level since 2007 — before retreating
- 10-year Treasury yield ended the week lower at 4.56%; 2-year yield rose to 4.13% (2–10 spread of ~43 bps)
- April FOMC minutes struck a hawkish tone, with most participants citing greater risk that inflation will take longer to reach the 2% target
- Market expectations have shifted away from near-term rate cuts, with some pricing in a possible rate hike by January
- Investment-grade corporate yields ended at 5.26%; high-yield corporate yields at 7.40%
Macroeconomic Data
- S&P Global May Flash Manufacturing PMI surged to 55.3, a four-year high; Services PMI eased slightly to 50.9
- Inflation pressures intensified — input costs rose at the fastest pace since late 2022; selling prices hit their highest since August 2022
- University of Michigan Consumer Sentiment fell for a third straight month to a record low of 44.8; year-ahead inflation expectations climbed to 4.8%
- Housing market remained soft — housing starts fell 2.8% and 30-year mortgage rates rose to 6.51%, the highest since August
- Initial jobless claims fell to 209,000, indicating labor market stability despite slower broader hiring

(as of Monday’s Market Opening)
| Total Return (1D) | Total Return (1W) | Total Return (MTD) | Total Return (QTD) | Total Return (YTD) | |
| S&P 500 | 0.49% | 2.13% | 4.18% | 15.04% | 9.71% |
| Dow Jones Industrial Average | -0.24% | 2.22% | 1.62% | 8.88% | 4.98% |
| NASDAQ | 0.88% | 2.73% | 6.77% | 23.09% | 14.35% |
| NASDAQ 100 | 1.00% | 3.32% | 8.47% | 25.42% | 17.93% |
| Russell 1000 | 0.52% | 1.55% | 4.05% | 14.63% | 9.71% |
| Russell 2000 | 1.31% | 4.05% | 3.92% | 16.47% | 17.55% |
| Russell 3000 | 0.58% | 1.66% | 4.11% | 14.64% | 10.07% |
| ACWI | 0.88% | 2.13% | 3.85% | 13.73% | 11.22% |
Global Client Survey
We’re inviting you to take part in a quick, anonymous client survey. Your feedback helps us fine-tune our process, elevate your experience, and ensure we’re delivering what matters most to you. This isn’t just about checking a box—it’s about shaping the future of how we serve you. Your voice helps guide our next steps. We’re listening. We’re learning. And we’re grateful for your trust.
Take Our Survey Now (click here)
Disclosures
- Wealth Mechanics™ is a registered trademark of Cestia Wealth Management. Unauthorized use of the trademark, including but not limited to commercial use, reproduction, or imitation without explicit written permission from Cestia Wealth Management, is strictly prohibited.
- Market commentary provided by NewEdge Advisors
- Charts concerning market data are provided by Exhibit A.
- Guides and other downloadable firm material respective to financial planning processes and data are provided and powered by fpPathfinder.
- Advisory services offered through NewEdge Advisors, LLC, a registered investment adviser. Securities offered through NewEdge Securities, LLC. Member FINRA/SIPC. NewEdge Advisors, LLC and NewEdge Securities, LLC are wholly owned subsidiaries of NewEdge Capital Group, LLC.
- Cestia Wealth Management is not a legal tax professional. We offer tax gap analysis for clients who desire to have a comprehensive financial plan, which requires in-depth tax strategy and planning as a distinct part of the overall customized solution. Please consult your tax professional on all matters addressed in this report.
- Information about annuities are not to be considered a recommendation. The information provided should not considered a recommendation to purchase or sell any particular security.
- Investing involves risk, including the potential loss of principal. No investment strategy can guarantee a profit or protect against loss in periods of declining values. Past performance is no guarantee of future results. Please note that individual situations can vary. Therefore, the information presented here should only be relied upon when coordinated with individual professional advice.
