



Week Ending July 10, 2026
Hot Topic: What Nvidia’s Valuation Multiple Is Really Telling Us
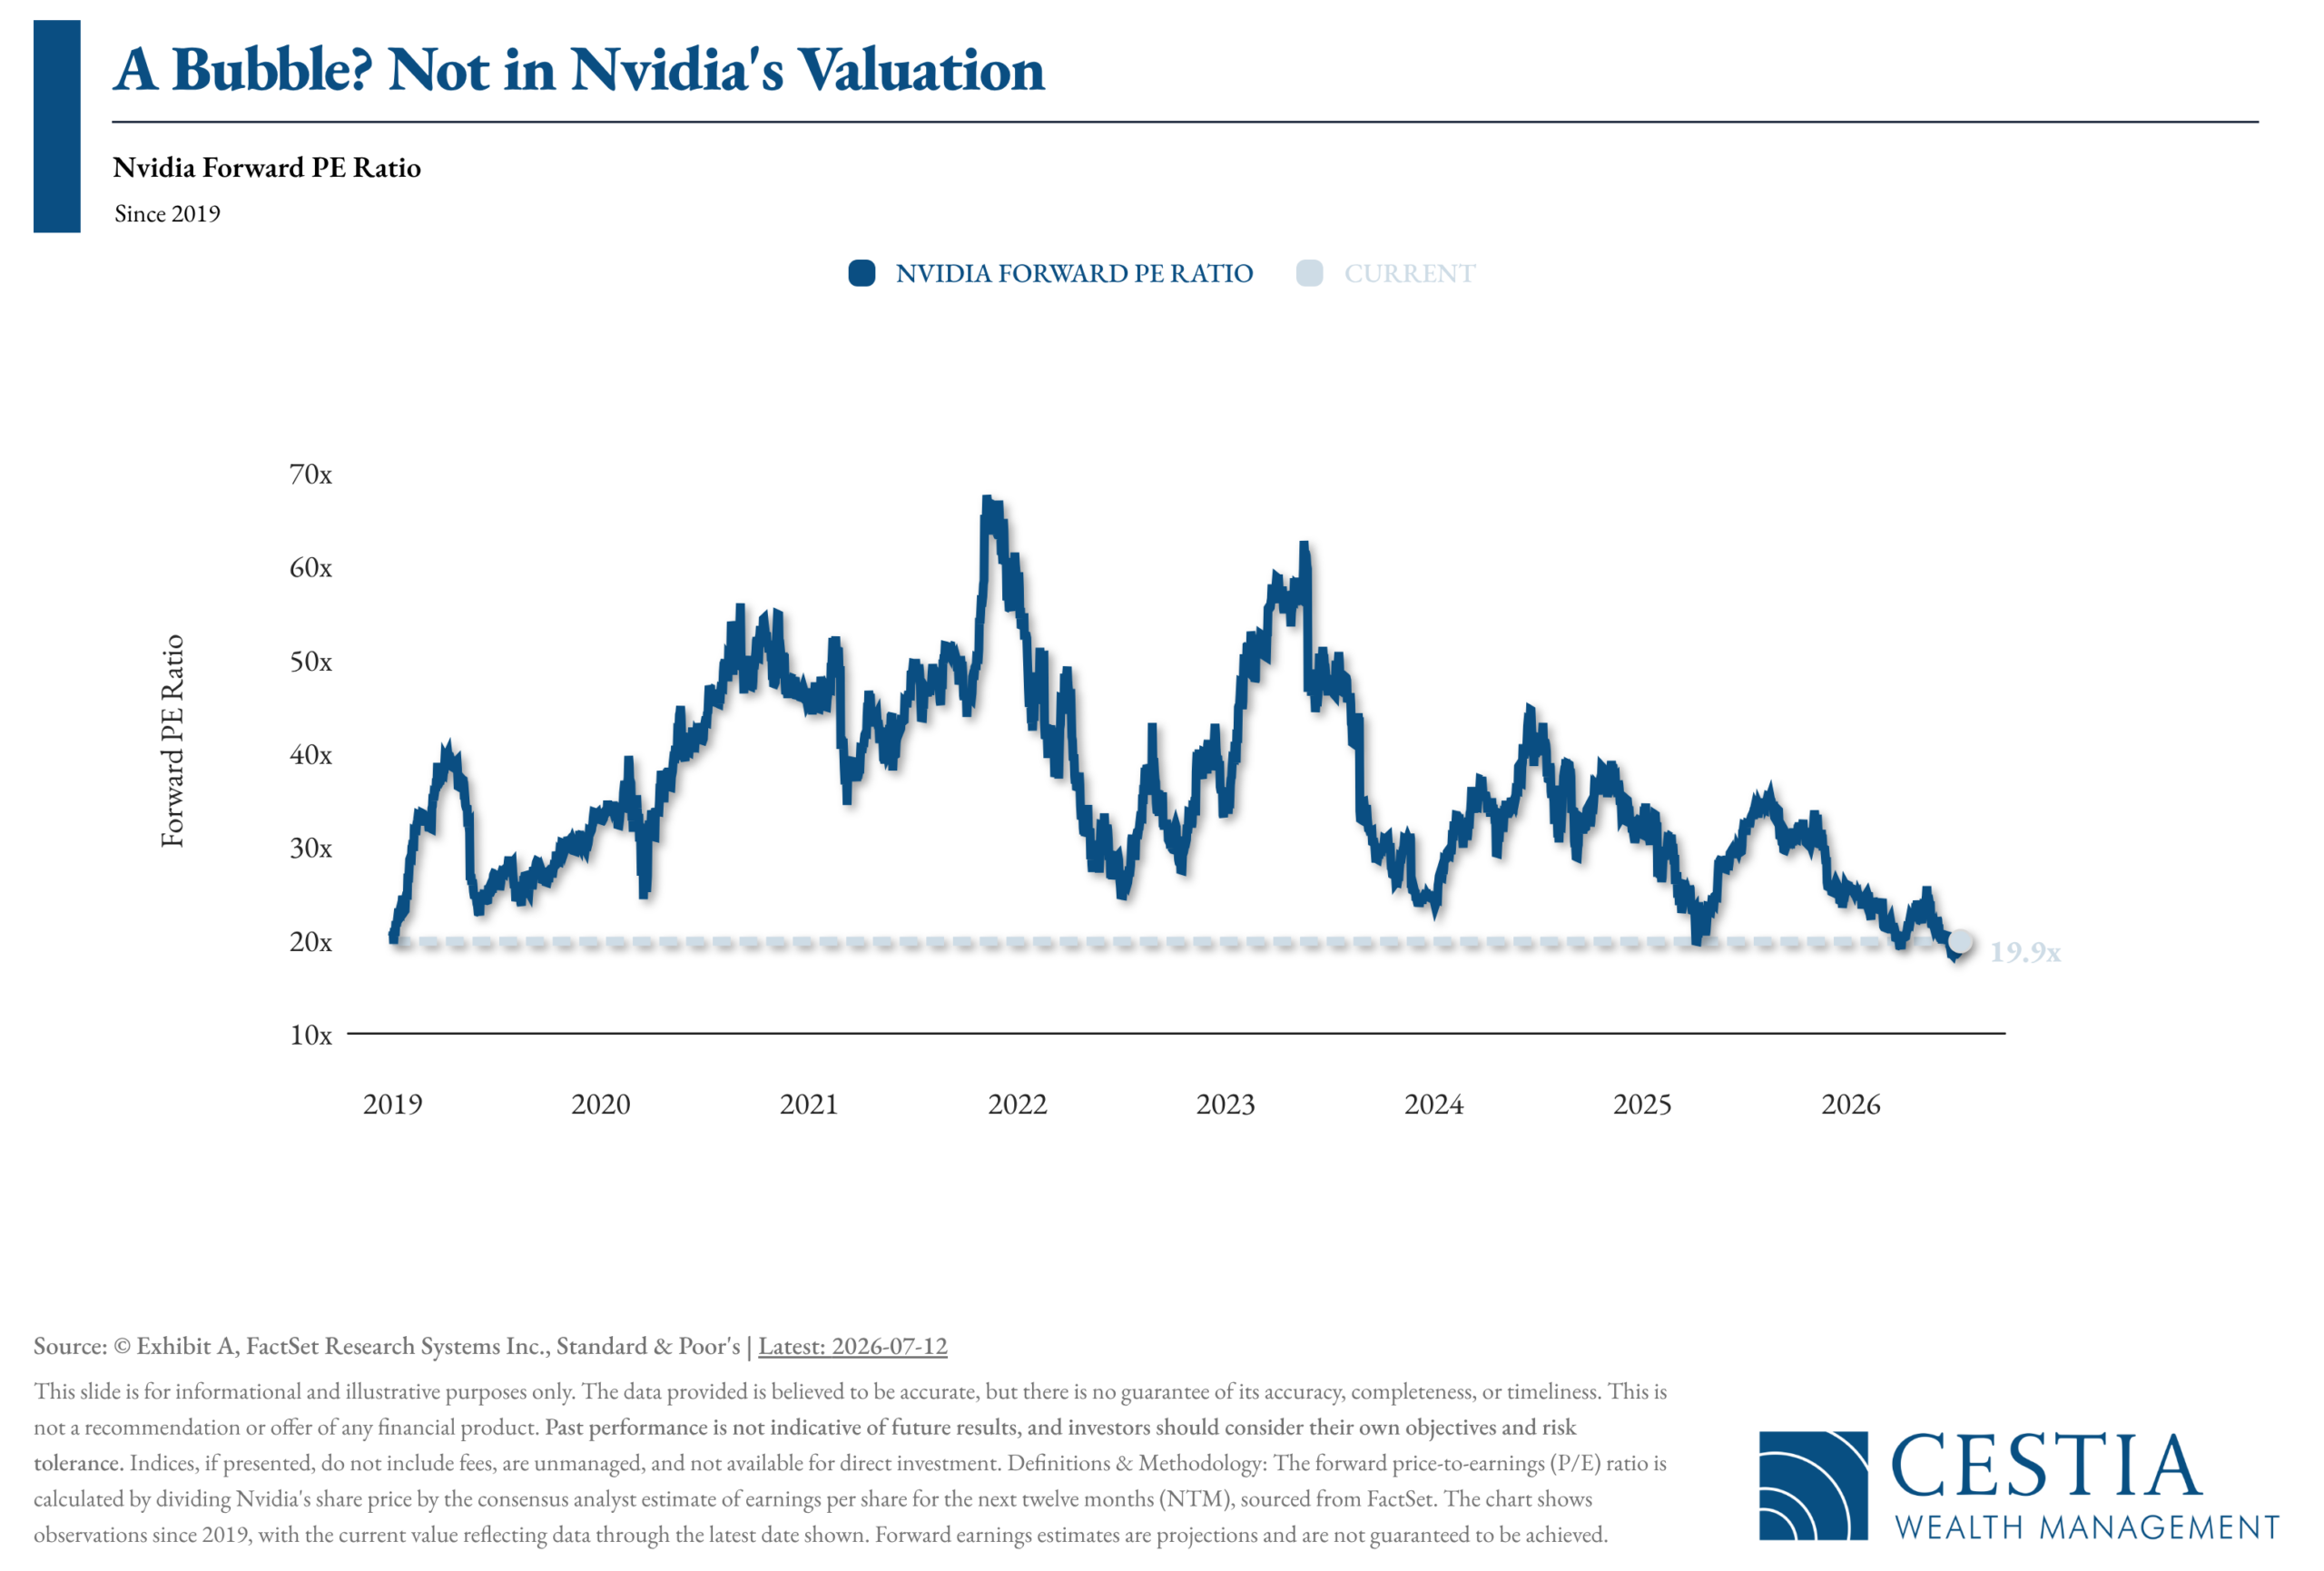
Nvidia’s forward price-to-earnings ratio — a measure comparing its share price to expected earnings over the next twelve months — currently stands at 19.9x. That’s near the low end of its range since 2019, and a steep drop from the roughly 65x peak reached in late 2021.
The key detail: this decline hasn’t come from a falling stock price. Nvidia shares have continued to climb. Instead, earnings estimates have grown even faster than the share price, which has steadily compressed the multiple over time.
A shrinking valuation multiple alongside a rising stock price has historically pointed to earnings growth outpacing price appreciation — not speculative excess. For clients who are uneasy about AI-related valuations, this is a useful data point for shifting the conversation from headlines back to fundamentals.

Oil Market is Attempting a System Reboot
Bank Earnings Bonanza Offers Top-to-Bottom Review of US Economy

Why Risk Tolerance and Risk Capacity Aren’t the Same Thing
When we build an investment strategy, two questions matter: how much risk are you willing to take, and how much risk can you afford to take. These sound similar, but they’re distinct — and treating them as one number can lead to the wrong portfolio.
Risk tolerance is about temperament — your comfort with market swings and your ability to stay invested through a downturn without losing sleep or abandoning the plan.
Risk capacity is about circumstance — your time horizon, income needs, and financial resources, which determine whether your goals could withstand a market setback.
Many traditional questionnaires blend these into a single score, which can create mismatches. A client with substantial assets and decades until retirement might score as having high capacity for risk — but if that same client has genuinely low tolerance for volatility, a blended score can still steer them toward a portfolio they can’t emotionally sustain through a downturn. The reverse is also true: a client eager to take on risk but with limited savings and near-term cash needs could be pushed into a portfolio their situation simply can’t support.
Our approach: rather than averaging tolerance and capacity together, we evaluate them separately. Each one acts as a check on the other — low tolerance or low capacity serves as a constraint on the portfolio we recommend, rather than being offset by a stronger score elsewhere. For clients with a comprehensive financial plan, the plan’s own projections (including probability-of-success modeling) offer a direct read on risk capacity, which we pair with a separate conversation about comfort and attitudes toward market risk.
The client benefit: a portfolio that reflects both what you can afford and what you’re comfortable with — not just a number that averages the two and quietly overlooks the more limiting one.
SOURCE: Kitces.com

Equities
- U.S. equity markets posted mixed but resilient results this week, as renewed geopolitical tensions between the U.S. and Iran drove volatility across oil prices, Treasury yields, and semiconductor stocks.
- The S&P 500 rose 1.26% and the Nasdaq advanced 1.74%, with growth outpacing value amid continued enthusiasm for artificial intelligence.
- Large-cap companies outperformed small- and mid-cap peers, as economically sensitive segments underperformed due to rising oil prices and geopolitical uncertainty weighing on industrial and value-oriented names.
- Information Technology led all sectors (+3.4%), while Materials, Health Care, and Industrials lagged.
- Energy rebounded meaningfully as oil prices recovered much of their recent decline.
- International markets underperformed U.S. large caps, with developed markets down 1.37% and emerging markets down 1.74%.
Bonds
- Fixed income markets declined as Treasury yields rose meaningfully, driven by renewed geopolitical tensions and related inflation concerns.
- The 10-year Treasury yield climbed to 4.56%, while the 2-year yield rose seven basis points to 4.21%, holding the 2–10 year spread steady at 0.35%.
- Longer-duration bonds bore the brunt of the move, with long-term investment-grade corporates down 1.3% and long-term government bonds down over 1.0%.
- High-yield bonds were the relative bright spot, with short- and intermediate-duration issues gaining 0.4% as improving risk sentiment and tighter credit spreads helped offset rising yields.
Macroeconomic Data
- Economic data was limited this week as markets focused on the Federal Reserve’s meeting minutes.
- ISM Services PMI eased slightly to 54.0 in June from 54.5 in May, in line with expectations and marking 24 consecutive months of expansion; employment improved, though new orders and business activity softened.
- Existing home sales fell 2.4% in June to an annualized rate of 4.09 million, as elevated prices and mortgage rates continued to pressure affordability.
- The Fed held interest rates steady at its June meeting, with unanimous support, though a few members had initially considered a hike.
- Looking ahead, the committee remains divided: one group anticipates rates holding flat or declining, while another expects further increases may be necessary before year-end.

(as of Monday’s Market Opening)
| Total Return
(1D) |
Total Return
(1W) |
Total Return (MTD) | Total Return (QTD) | Total Return (YTD) | |
| S&P 500 | 0.42% | 0.50% | 1.01% | 1.01% | 10.66% |
| Dow Jones Industrial Average | 0.29% | -0.79% | 0.61% | 0.61% | 9.52% |
| NASDAQ | 0.29% | 0.61% | 0.26% | 0.26% | 13.08% |
| NASDAQ 100 | 0.33% | 0.43% | -1.49% | -1.49% | 18.12% |
| Russell 1000 | 0.36% | 1.07% | 0.88% | 0.88% | 11.12% |
| Russell 2000 | -0.42% | -0.53% | -1.48% | -1.48% | 20.74% |
| Russell 3000 | 0.27% | 1.01% | 0.74% | 0.74% | 11.52% |
| ACWI | 0.42% | 0.98% | 0.45% | 0.45% | 12.17% |
Global Client Survey
We’re inviting you to take part in a quick, anonymous client survey. Your feedback helps us fine-tune our process, elevate your experience, and ensure we’re delivering what matters most to you. This isn’t just about checking a box—it’s about shaping the future of how we serve you. Your voice helps guide our next steps. We’re listening. We’re learning. And we’re grateful for your trust.
Take Our Survey Now (click here)
Disclosures
- Wealth Mechanics™ is a registered trademark of Cestia Wealth Management. Unauthorized use of the trademark, including but not limited to commercial use, reproduction, or imitation without explicit written permission from Cestia Wealth Management, is strictly prohibited.
- Market commentary provided by NewEdge Advisors
- Charts concerning market data are provided by Exhibit A.
- Guides and other downloadable firm material respective to financial planning processes and data are provided and powered by fpPathfinder.
- Advisory services offered through NewEdge Advisors, LLC, a registered investment adviser. Securities offered through NewEdge Securities, LLC. Member FINRA/SIPC. NewEdge Advisors, LLC and NewEdge Securities, LLC are wholly owned subsidiaries of NewEdge Capital Group, LLC.
- Cestia Wealth Management is not a legal tax professional. We offer tax gap analysis for clients who desire to have a comprehensive financial plan, which requires in-depth tax strategy and planning as a distinct part of the overall customized solution. Please consult your tax professional on all matters addressed in this report.
- Information about annuities are not to be considered a recommendation. The information provided should not considered a recommendation to purchase or sell any particular security.
- Investing involves risk, including the potential loss of principal. No investment strategy can guarantee a profit or protect against loss in periods of declining values. Past performance is no guarantee of future results. Please note that individual situations can vary. Therefore, the information presented here should only be relied upon when coordinated with individual professional advice.
