



Week Ending July 24, 2026
When Headlines Get Loud, Discipline Gets Rewarded
Markets have had a turbulent stretch. U.S. stocks fell for the week amid renewed Middle East tensions, with military strikes resuming and the administration threatening to reinstate a surcharge on cargo moving through the Strait of Hormuz. Technology led the decline, off roughly 4% on the week, and semiconductor stocks have corrected more than 20% from their June 22 peak, even as year-to-date gains in the group remain substantial. The S&P 500 itself closed down about 1% on July 17, settling at 7,457.69.
It would be easy to read a week like this as a signal to step to the sidelines. The data says otherwise. Despite the noise, the S&P 500 has still added roughly 9% year to date, building on a return of 9.7% since January 1, 2026 — resilience that’s notable given headwinds including trade-policy uncertainty and elevated oil prices tied to the Iran conflict.
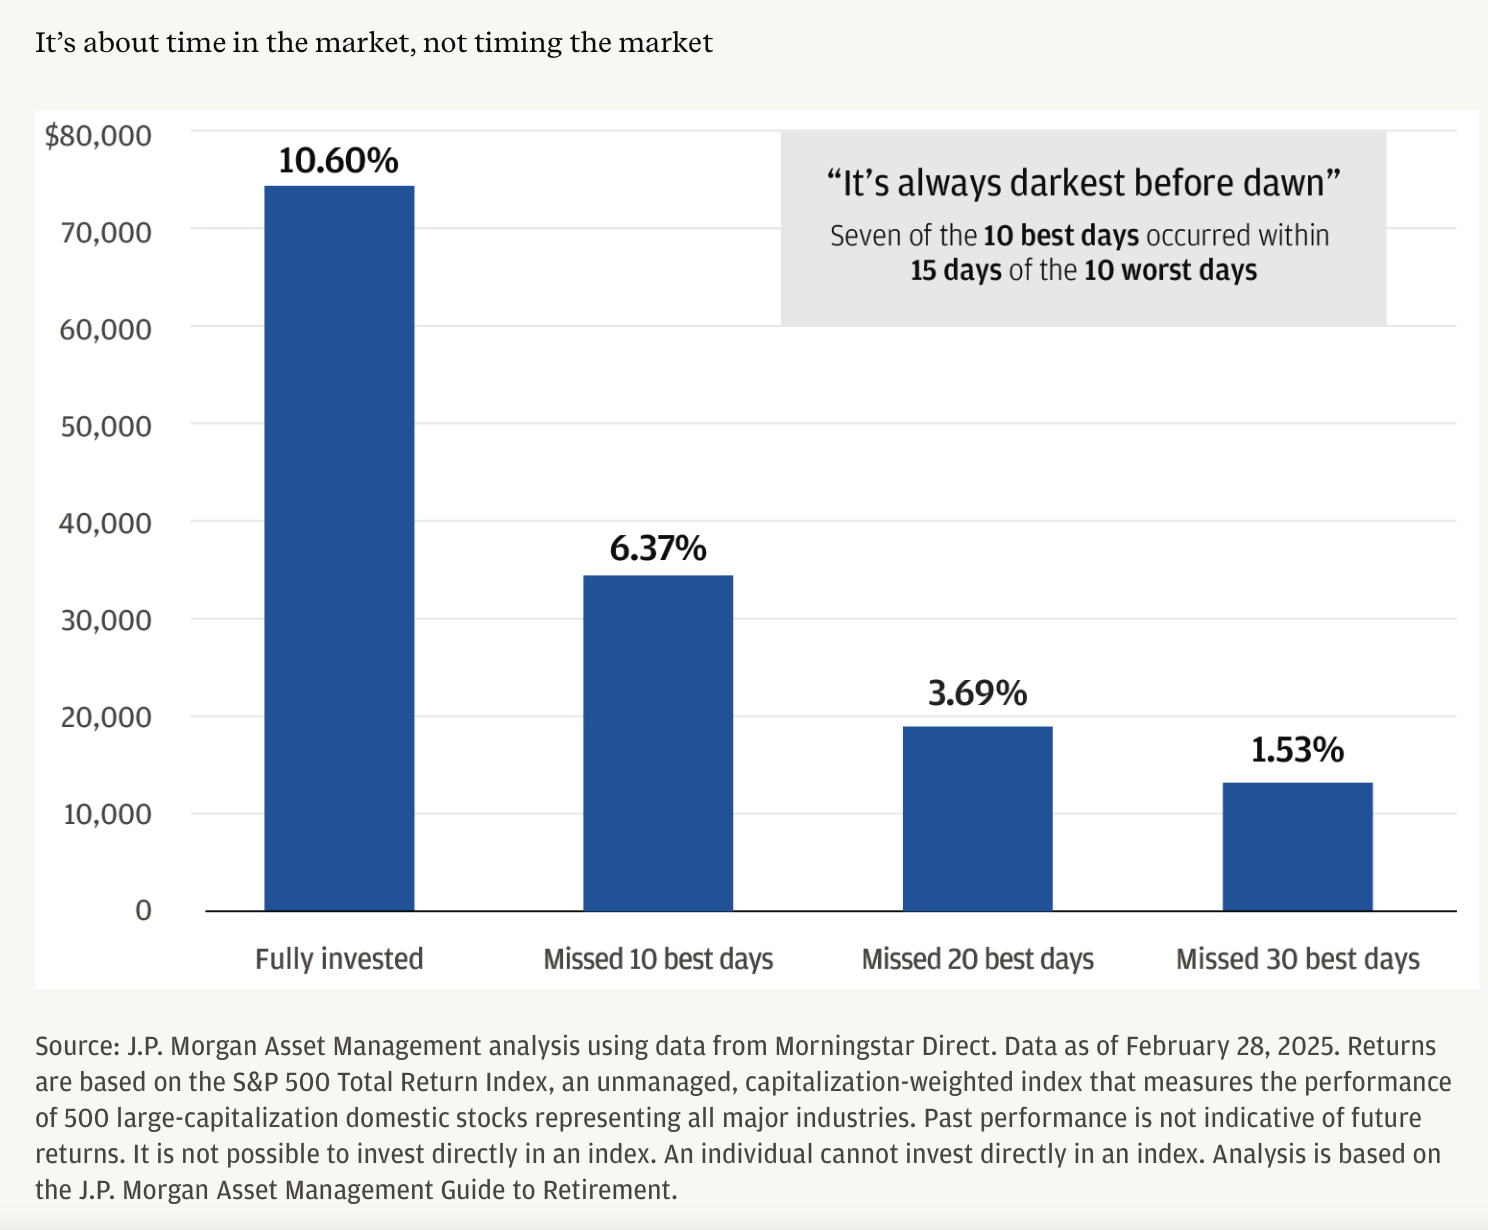
This is precisely the pattern the accompanying J.P. Morgan chart illustrates. A hypothetical $10,000 invested in the S&P 500 and left fully invested grew to roughly $75,000 over the period studied, a 10.60% annualized return. Missing just the 10 best trading days cut that return nearly in half, to 6.37%. Missing 20 or 30 of the best days reduced it further still, to 3.69% and 1.53%, respectively. The reason this matters isn’t abstract: seven of the ten best days on record occurred within 15 days of the ten worst days. The rebound and the selloff tend to travel together — which is exactly what a portfolio in cash risks missing.
The lesson for weeks like this one isn’t to ignore volatility. It’s to recognize that reacting to it is often more costly than sitting through it. Staying invested — not attempting to time the reentry — has historically been the strategy that captured the recovery.

After the Reset: Time to Focus on Fundamentals
4 Big Questions About the Economy
Saudi Nuclear Deal Confusion Threatens Billions in Potential US Manufacturing Sales
Mounting US Budget Deficit Complicates Fed’s Interest Rate Choices

Common Savings Accounts for Children
Many parents want to start setting money aside for their children, but they’re often unsure about where they should actually save the money.
There are several options available. Some accounts remain in the parents’ names and can be gifted later, offering flexibility. Others involve irrevocable gifts that permanently belong to the child. Some strategies provide tax advantages, while others prioritize control or simplicity.
To help support these conversations, We’ve put together this guide that walks through several common ways parents save for children, highlighting the pros and cons of each option and why someone might consider one strategy over another.
- Understand common savings options for children
- Compare flexibility vs. tax benefits
- Recognize when a strategy involves irrevocable gifting
- Start thoughtful conversations about family planning goals

Markets opened the week with a relief rally after a soft finish to last week, when stocks came under pressure following a poor reception to Alphabet’s (GOOG/GOOGL) earnings. Investors soured on heavy capital-expenditure plans that pushed free cash flow negative for the quarter — the company spent more on capex than it generated in operating cash flow. That capex debate will be tested further this week as hyperscalers Amazon (AMZN), Meta (META), and Microsoft (MSFT) all report earnings.
A full one-third of the S&P 500 reports earnings this week. Second-quarter earnings season has been notably strong, with growth tracking at an eye-popping 37.9% — though that figure is skewed higher by a large one-time gain at Alphabet; excluding it, growth would be a still-robust 25.9%.
The Fed also delivers its July rate decision this week. As of Monday, the market is pricing a 34% probability of a hike — a notably high and ambiguous reading this close to the meeting date. The week’s most important economic data — Personal Consumption Expenditures inflation, spending, and income — will be released after the Fed’s decision.

(as of Monday’s Market Opening)
| Total Return (1D) | Total Return (1W) | Total Return (MTD) | Total Return (QTD) | Total Return (YTD) | |
| S&P 500 | -1.13% | -2.05% | -2.06% | -2.06% | 7.30% |
| Dow Jones Industrial Average | -1.75% | -0.75% | -0.94% | -0.94% | 7.83% |
| NASDAQ | -1.46% | -4.59% | -6.49% | -6.49% | 5.47% |
| NASDAQ 100 | -1.75% | -5.94% | -9.91% | -9.91% | 8.03% |
| iShares Russell 1000 ETF | -1.21% | -1.96% | -2.15% | -2.15% | 7.78% |
| iShares Russell 2000 ETF | -1.63% | -1.77% | -3.95% | -3.95% | 17.72% |
| iShares Russell 3000 ETF | -1.19% | -2.13% | -2.22% | -2.22% | 8.24% |
| iShares ACWI ETF | -1.24% | -2.35% | -2.77% | -2.77% | 8.57% |
Global Client Survey
We’re inviting you to take part in a quick, anonymous client survey. Your feedback helps us fine-tune our process, elevate your experience, and ensure we’re delivering what matters most to you. This isn’t just about checking a box—it’s about shaping the future of how we serve you. Your voice helps guide our next steps. We’re listening. We’re learning. And we’re grateful for your trust.
Take Our Survey Now (click here)
Disclosures
- Wealth Mechanics™ is a registered trademark of Cestia Wealth Management. Unauthorized use of the trademark, including but not limited to commercial use, reproduction, or imitation without explicit written permission from Cestia Wealth Management, is strictly prohibited.
- Market commentary provided by NewEdge Advisors
- Charts concerning market data are provided by Exhibit A.
- Guides and other downloadable firm material respective to financial planning processes and data are provided and powered by fpPathfinder.
- Advisory services offered through NewEdge Advisors, LLC, a registered investment adviser. Securities offered through NewEdge Securities, LLC. Member FINRA/SIPC. NewEdge Advisors, LLC and NewEdge Securities, LLC are wholly owned subsidiaries of NewEdge Capital Group, LLC.
- Cestia Wealth Management is not a legal tax professional. We offer tax gap analysis for clients who desire to have a comprehensive financial plan, which requires in-depth tax strategy and planning as a distinct part of the overall customized solution. Please consult your tax professional on all matters addressed in this report.
- Information about annuities are not to be considered a recommendation. The information provided should not considered a recommendation to purchase or sell any particular security.
- Investing involves risk, including the potential loss of principal. No investment strategy can guarantee a profit or protect against loss in periods of declining values. Past performance is no guarantee of future results. Please note that individual situations can vary. Therefore, the information presented here should only be relied upon when coordinated with individual professional advice.
