



Week Ending June 12, 2026
Tech Today vs. The Dotcom Bubble
This is worth repeating!
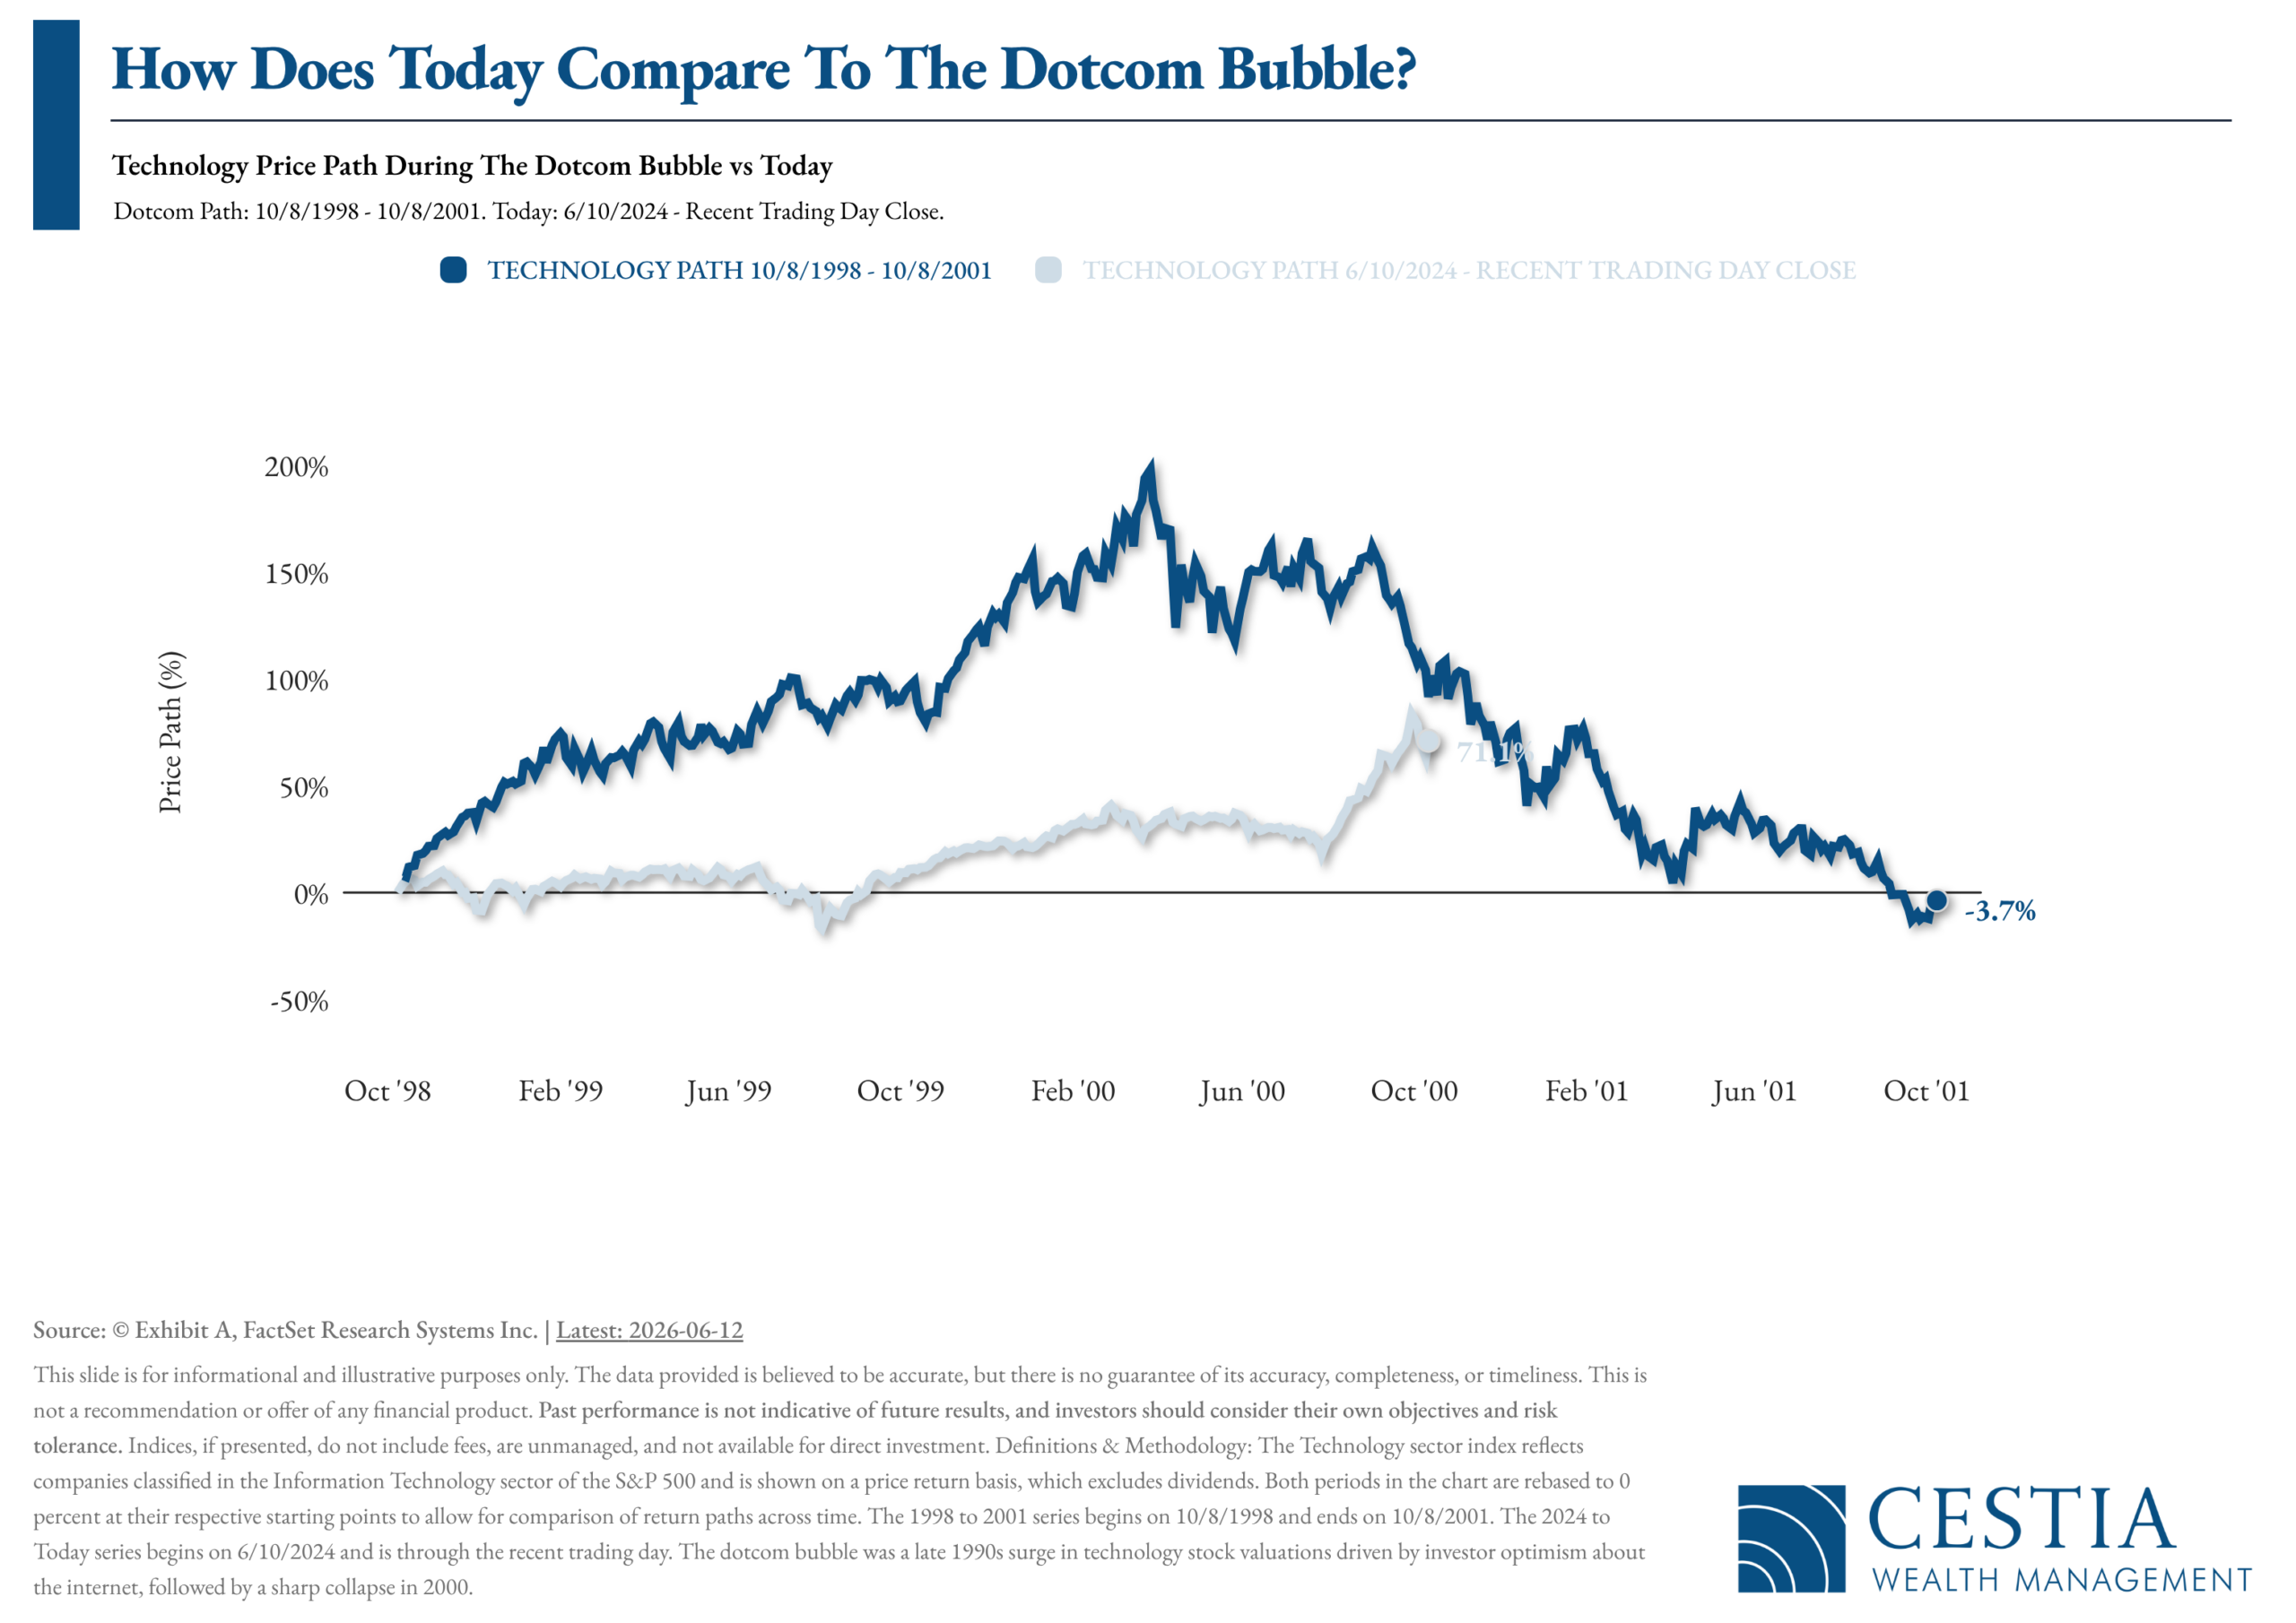
A chart circulating in market commentary circles has drawn renewed attention to a familiar question: Is the current technology sector rally following the same path as the Dotcom boom of the late 1990s? The comparison overlays the technology sector’s return trajectory from October 1998 through October 2001 against the current period beginning in June 2024 — a side-by-side view designed to test whether history is repeating itself.
The short answer, based on the data, is that it is not. When the two periods are examined together, the return patterns diverge in meaningful ways. Rather than tracking a similar trajectory, each timeframe reflects its own distinct set of market conditions, economic dynamics, and investor behavior. The visual alignment of starting points does not translate into alignment of outcomes.
This distinction matters for investors. Historical comparisons can offer useful context — they remind us that elevated valuations and sector enthusiasm are not new phenomena — but they carry an important limitation: past market episodes are not predictive of future results. The purpose of this comparison is not to forecast a repeat of the Dotcom correction, nor to suggest that current conditions are immune from volatility. It is simply to provide context. The current return path has not mirrored the movements observed during the Dotcom period, and drawing direct parallels between the two would require ignoring the very different fundamental, monetary, and structural backdrops at play today.

Hormuz to Reopen as Iran, US Agree to Pause War
The SpaceX IPO Is About Way More Than Just Rocket Ships
How Much Will SpaceX Actually Cost Your Index Fund?
JPMorgan, Citi and Big Banks Plan New Tokenized Deposit System to Answer Crypto

Foundation in Digital Assets | Part 4: What Is Decentralized Finance (DeFi)?
For most of modern history, accessing financial services has required a middleman — a bank to hold your deposits, a broker to execute your trades, a lender to approve your loan. Decentralized Finance, commonly referred to as DeFi, is a rapidly growing segment of the digital asset ecosystem built on a simple premise: what if those services could run on software instead?
DeFi refers to a collection of financial applications built on blockchain networks — most commonly Ethereum — that allow users to lend, borrow, trade, and earn yield without relying on a traditional financial institution. These applications operate through self-executing contracts called smart contracts: coded agreements that automatically carry out the terms of a transaction when predetermined conditions are met, with no bank, broker, or clearinghouse required.
The appeal of this model is its accessibility. DeFi protocols are open to anyone with an internet connection and a digital wallet, operating around the clock without the business hours, account minimums, or geographic restrictions of conventional finance. Transactions settle in minutes rather than days.
The risks, however, are equally distinctive. DeFi operates largely outside the regulatory perimeter — there is no FDIC insurance, no investor protection fund, and no compliance framework governing most protocols today. Smart contract code, while transparent, can contain vulnerabilities that bad actors exploit. And the assets involved remain highly volatile.
DeFi does not represent a replacement for the regulated financial system. What it does represent is a shift in how financial infrastructure can be designed — one that institutions, regulators, and long-term investors are watching closely.
Next in the series — Part 5: How Investors Gain Exposure. We examine the practical ways investors access digital assets today — from exchange-traded products and direct ownership to custody considerations and portfolio sizing.
Source: Digital Assets Council of Financial Professionals (DACFP), an independent educational organization recognized by the CFP Board of Standards, CFA Institute, and listed in FINRA’s database of professional designations.

Equities
- Stocks rebounded last week despite inflation data and geopolitical uncertainty, with sentiment improving as Middle East tensions eased and U.S.-Iran negotiations progressed
- Small-cap stocks led the advance; mid-caps also posted strong weekly gains
- Value outperformed growth across all market capitalizations, extending its year-to-date leadership as investor interest broadened beyond mega-cap technology
- Sector rotation continued, with Materials, Consumer Staples, Financials, Real Estate, and Industrials leading; Energy and Communication Services lagged
- International developed markets finished higher, outperforming emerging markets, which were essentially flat on the week
Bonds
- The Bloomberg U.S. Aggregate Bond Index gained 0.52% for the week as Treasury prices stabilized
- The 2-year Treasury yield closed at 4.09%; the 10-year finished at 4.48%, leaving the 2-10 spread at 0.39%
- Markets largely looked past inflation data, focusing on easing geopolitical risk and the upcoming Fed meeting, where rates are widely expected to remain unchanged
- Investment-grade corporate yields ended the week at 5.19%; high-yield at 7.40%, with both posting positive weekly returns reflecting continued credit market resilience
Macroeconomic Data
- May CPI rose 0.5% for the month and 4.2% year-over-year — the fastest annual pace in roughly three years — though core CPI remained more contained at 0.2% monthly and 2.9% annually
- Producer prices surprised to the upside, with PPI climbing 1.1% in May
- Initial jobless claims edged up to 229,000, signaling modest labor market moderation while remaining at historically healthy levels
- The preliminary University of Michigan Consumer Sentiment Index improved to 48.9 from a record low of 44.8 in May, supported by lower gasoline prices and easing inflation expectations

(as of Monday’s Market Opening)
| Total Return
(1D) |
Total Return
(1W) |
Total Return (MTD) | Total Return (QTD) | Total Return (YTD) | |
| S&P 500 | 1.73% | 2.08% | -0.26% | 15.80% | 10.44% |
| Dow Jones Industrial Average | 1.26% | 2.09% | 1.60% | 11.88% | 7.87% |
| NASDAQ | 2.68% | 2.52% | -1.44% | 23.13% | 14.38% |
| NASDAQ 100 | 2.77% | 3.54% | 0.41% | 28.29% | 20.62% |
| Russell 1000 | 1.53% | 2.19% | -0.26% | 15.50% | 10.54% |
| Russell 2000 | 0.77% | 4.81% | 1.64% | 19.03% | 20.13% |
| Russell 3000 | 1.49% | 2.29% | -0.13% | 15.54% | 10.93% |
| ACWI | 1.07% | 2.43% | -0.25% | 14.29% | 11.77% |
Global Client Survey
We’re inviting you to take part in a quick, anonymous client survey. Your feedback helps us fine-tune our process, elevate your experience, and ensure we’re delivering what matters most to you. This isn’t just about checking a box—it’s about shaping the future of how we serve you. Your voice helps guide our next steps. We’re listening. We’re learning. And we’re grateful for your trust.
Take Our Survey Now (click here)
Disclosures
- Wealth Mechanics™ is a registered trademark of Cestia Wealth Management. Unauthorized use of the trademark, including but not limited to commercial use, reproduction, or imitation without explicit written permission from Cestia Wealth Management, is strictly prohibited.
- Market commentary provided by NewEdge Advisors
- Charts concerning market data are provided by Exhibit A.
- Guides and other downloadable firm material respective to financial planning processes and data are provided and powered by fpPathfinder.
- Advisory services offered through NewEdge Advisors, LLC, a registered investment adviser. Securities offered through NewEdge Securities, LLC. Member FINRA/SIPC. NewEdge Advisors, LLC and NewEdge Securities, LLC are wholly owned subsidiaries of NewEdge Capital Group, LLC.
- Cestia Wealth Management is not a legal tax professional. We offer tax gap analysis for clients who desire to have a comprehensive financial plan, which requires in-depth tax strategy and planning as a distinct part of the overall customized solution. Please consult your tax professional on all matters addressed in this report.
- Information about annuities are not to be considered a recommendation. The information provided should not considered a recommendation to purchase or sell any particular security.
- Investing involves risk, including the potential loss of principal. No investment strategy can guarantee a profit or protect against loss in periods of declining values. Past performance is no guarantee of future results. Please note that individual situations can vary. Therefore, the information presented here should only be relied upon when coordinated with individual professional advice.
